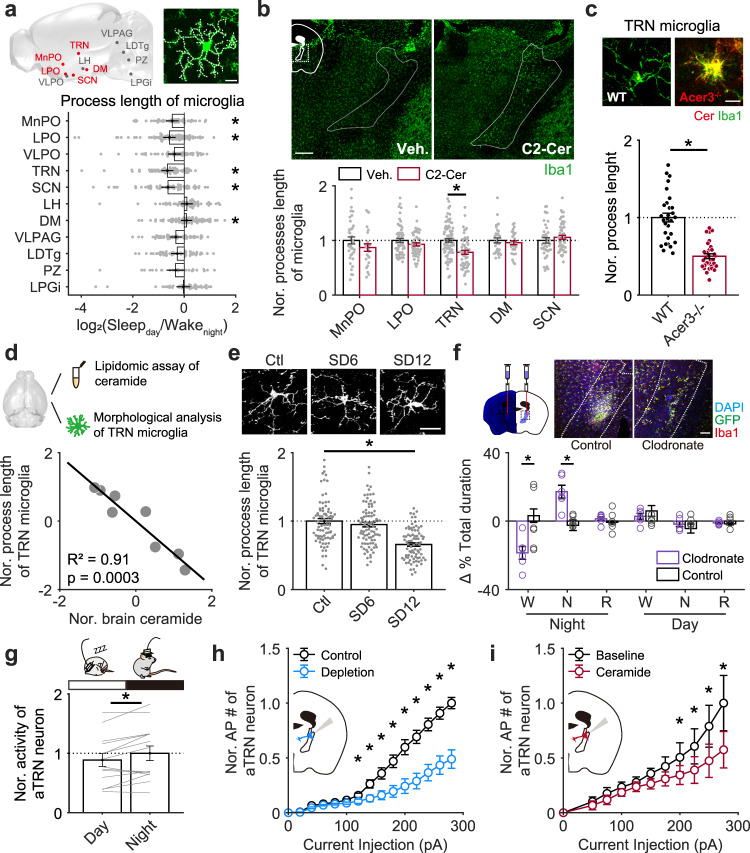
Fig. 4. High sensitivity of TRN microglia to brain ceramide.
a Diurnal differences in the total lengths of microglial processes in sleep/wakefulness-related brain regions (Sleepday, 3 mice; Wakenight, 3 mice). A sagittal brain cartoon showing the regions examined, with red dots representing regions with significant Sleepday/Wakenight differences in microglial morphology. The white dashed line on the representative microglia indicates the measured processes. Scale bar, 10 µm. The p value for each brain region was obtained by compare the difference of microglial process length between Sleepday and Wakenight, each dot represents log2 of ratio (Sleepday/mean value of Wakenight). MnPO, median preoptic area, p = 0.015 for Sleepday (n = 65) vs Wakenight (n = 49); LPO lateral preoptic area, p = 5.4 × 10⁻⁴ for Sleepday (n = 84) vs Wakenight (n = 92); VLPO ventrolateral preoptic area (Sleepday, n = 53; Wakenight, n = 55); TRN thalamic reticular nucleus, p = 1.5 × 10⁻⁶ for Sleepday (n = 64) vs Wakenight (n = 70); SCN suprachiasmatic nucleus, p = 0.006 for Sleepday (n = 48) vs Wakenight (n = 69); LH lateral hypothalamus (Sleepday, n = 59; Wakenight, n = 70); DM dorsomedial hypothalamus, p = 0.039 for Sleepday (n = 83) vs Wakenight (n = 88); VLPAG ventrolateral periaqueductal grey matter (Sleepday, n = 64; Wakenight, n = 59); LDTg laterodorsal tegmental nucleus (Sleepday, n = 89; Wakenight, n = 53); PZ parafacial zone (Sleepday, n = 16; Wakenight, n = 25); LPGi lateral paragigantocellular nucleus (Sleepday, n = 37; Wakenight, n = 48). b Exogenous application of C2-ceramide specifically altered Iba1 fluorescence and microglial morphology by a retraction of processes in the TRN region (Veh. Vehicle, 6 mice; MnPO, n = 38 cells; LPO, n = 25 cells; TRN, n = 85 cells; DM, n = 32 cells; SCN, n = 45 cells. C2-Cer, C2-ceramide, 4 mice; MnPO, n = 25 cells; LPO, n = 55 cells; TRN, n = 57 cells; DM, n = 31 cells; SCN, n = 51 cells). p = 2.5 × 10⁻⁵ in TRN region for Veh. vs C2-Cer. Each dot represents one microglia. Brain tissue was collected 3 h after i.c.v. injection. Representative images with Iba1 staining were taken from TRN-containing brain sections, with the TRN outlined with white dashed lines. The dashed square within the cartoon inset indicates the brain regions from which images were taken. Scale bar, 200 µm. c Total process lengths of TRN microglia in wild-type (WT) and Acer3 knockout (Acer3−/−) mice (WT, n = 30 cells from 2 mice; Acer3−/−, n = 31 cells from 3 mice; p = 8.1 × 10⁻¹⁰ for WT vs Acer3−/−). Each dot represents one microglia. Scale bar, 10 µm. d Correlation between brain ceramide level and microglial morphology in naïve mice. Subcortical ceramide level and total process length of TRN microglia were analyzed in the same mouse. Total process length of at least 20 TRN microglia was measured for each mouse, and the averaged value was used for further analysis. Pearson’s correlation, p value was calculated using two-sided hypothesis test. n = 8 mice. e TRN microglia retracted processes following sleep deprivation. Representative image with Iba1 staining shown TRN microglia in control and sleep-deprived mice. Scale bar, 20 µm. Ctl control mice, 86 cells from 4 mice; SD6, mice with 6 h of sleep deprivation, 91 cells from 4 mice; SD12, mice with 12 h of sleep deprivation, 81 cells from 4 mice. Each dot represents one microglia. f Local injection of clodronate liposomes into the anterior thalamic reticular nucleus (aTRN) effectively depleted microglia (top) and facilitated NREM sleep specifically at night (bottom). Scale bar, 100 µm. Clodronate vs Control at night: p = 0.003 for W; p = 0.003 for N. Clodronate liposomes, n = 6 mice; control liposomes, n = 6 mice. Each open circle represents the difference, before and after local administration, in one mouse, and then these differences were compared between clodronate-treated and control mice. g aTRN neuronal firing rate (n = 14 mice with 248 neurons been collected) during daytime and night-time. Each line represents change in mean firing rate of aTRN neurons between day and night in one mouse. p = 0.012 for day vs night. h Compared to control mice (11 neurons from 3 mice), action potentials induced by higher current injections were reduced in aTRN neurons from microglia-depleted mice (17 neurons from two mice; p < 0.05 for current injection high than 120 pA). i Application of C2-ceramide (10 µM) reduced aTRN neuronal excitability (9 neurons from 3 mice; p < 0.05 for current injection high than 200 pA). *p < 0.05; two-sided unpaired t-test for a–c, e, f, and h. Two-sided paired t-test for g and i. Data are reported as mean ± SEM. See also Supplementary Fig. 5.

