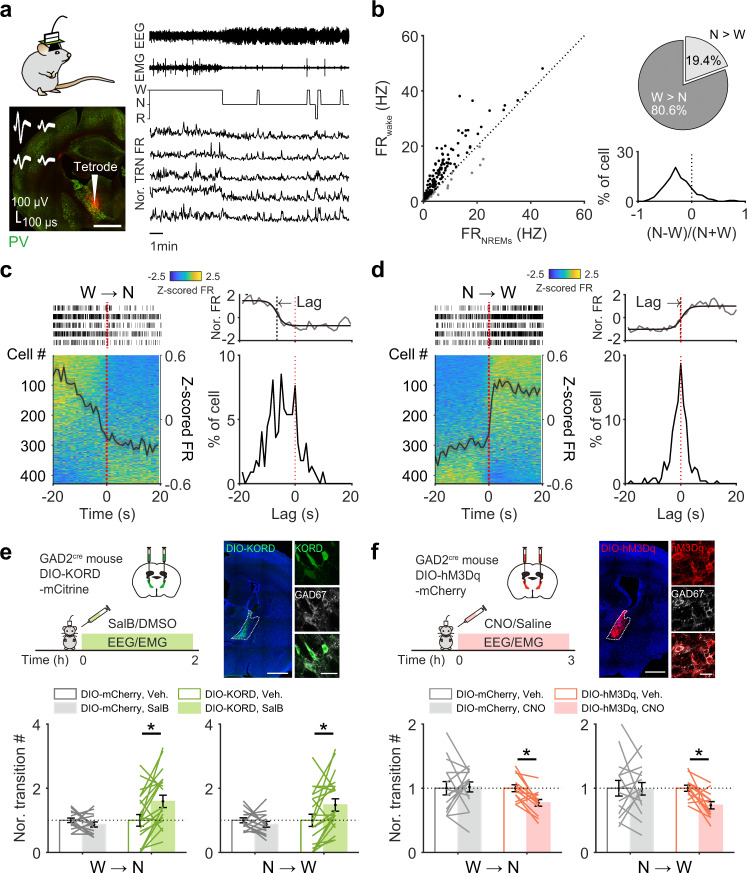
Fig. 5. aTRN neuronal activity controls transitions between wakefulness and NREM sleep.
a Simultaneous recordings of aTRN neuronal activity and sleep architecture via tetrode/EEG/EMG implants. The TRN is represented with parvalbumin (PV) staining (red signal, tetrode tip location). b Left, scatter plot of aTRN neuron firing rates (FR) during wakefulness (y-axis) against during NREM sleep (x-axis). Right, distribution of firing preferences between wakefulness and NREM sleep (191 neurons from 14 mice). c, d Left side, activity of aTRN neurons 20 s before and after transition onsets from wakefulness to NREM sleep (c, W → N), or d from NREM sleep to wakefulness (N → W, 428 cells from 23 mice). The black trace indicates average normalized neuronal activity. The raster plots represent spike events from five representative aTRN neurons. Right side, lag time distributions relative to transition onset (the red-dashed line), and an example of logistic fitting is shown at the top. e, f Chemogenetic inhibition (e via DIO-KORD), or activation (f via DIO-hM3Dq), of aTRN neuron controls state transitions between wakefulness and NREM sleep. Top, experimental procedure (left) and validation (right) of virus expression in the aTRN of GAD2cre mice (scale bars: left = 1 mm; right = 50 µm). Bottom, differences in state transition numbers between wakefulness and NREM sleep in mice with chemogenetic inhibition (e, DIO-KORD, p = 0.002 for W → N and p = 0.010 for N → W, n = 21 pairs of recordings from 7 mice; DIO-mCherry, n = 15 pairs of recordings from 5 mice) or with chemogenetic activation of aTRN neurons (f, DIO-hM3Dq, p = 0.004 for W → N and p = 0.002 for N → W, n = 13 pairs of recordings from 4 mice; DIO-mCherry, n = 15 pairs of recordings from 5 mice). Each line represents the change in transition number between recording sessions with vehicle or CNO/SalB injection collected from one mouse. *p < 0.05; two-sided paired Wilcoxon signed rank test for e and f. Data are reported as mean ± SEM. See also Supplementary Figs. 6–8.

