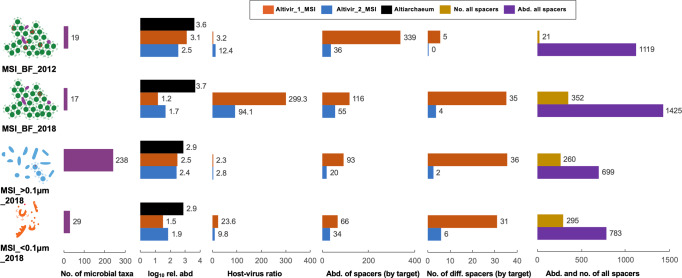
Fig. 4. Development of host–virus and spacer dynamics from 2012 to 2018 based on metagenomics from the Mühlbacher Schwefelquelle, Isling (MSI).
Predicted viruses Altivir_1_MSI and Altivir_2_MSI became less abundant from 2012 to 2018. Data are presented for biofilms (BF) from 2012 and 2018 as well as the planktonic fraction (>0.1 µm) and the viral fraction (<0.1 µm). Considering the BFs, total spacer abundance and numbers increased from 2012 to 2018 while those matching Altivir_1_MSI decreased in abundance but increased in numbers. Number (no.) of microbial taxa refers to the number of different prokaryotes in a sample detected via rpS3 rank abundance curves (normalized by sequencing depth). Host–virus ratio is calculated from host and virus coverage based on read mapping. Abundance and number of different spacers were normalized to minimum relative abundance (rel. abd.) of the host based on read mapping. Color definition of bars: violet = number of microbial taxa, orange-red = features of Altivir_1_MSI, blue = features of Altivir_2_MSI, black = log10 relative abundance of Altiarchaeum, ocher = number of all spacers, and purple = abundance of all spacers.

