Fig. 6.
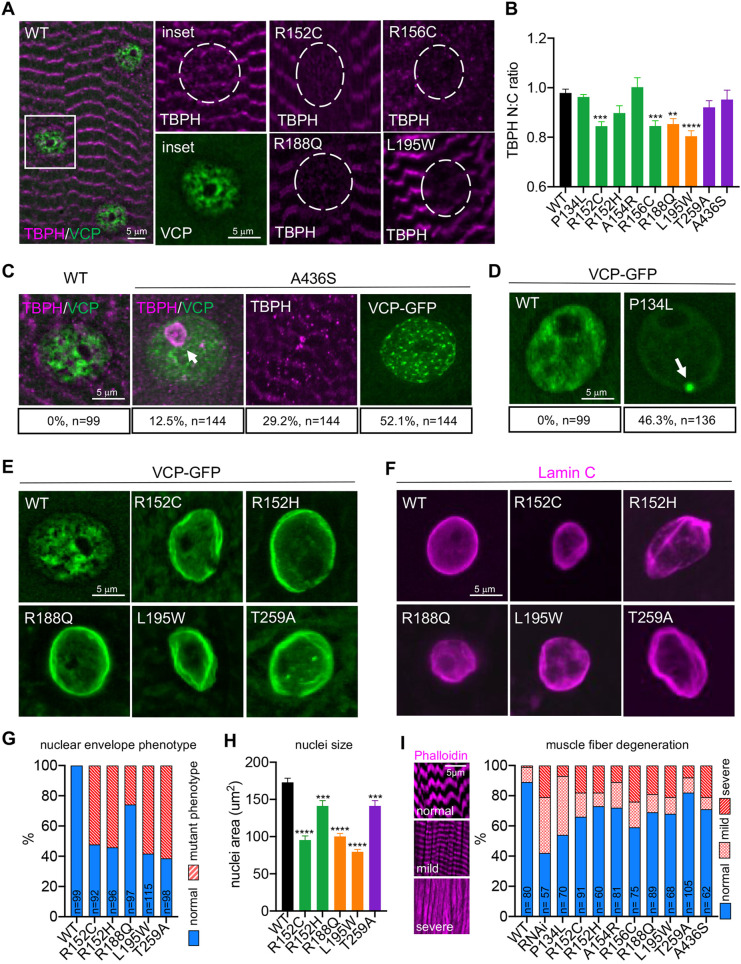
Cellular pathology in larval muscles. (A) TBPH staining in larval body wall muscles for the indicated genotypes. Dashed circles indicate the nucleus. (B) Nuclear to cytoplasmic ratio of TDP43 distribution in larval body wall muscles for the indicated genotypes. n>50 nuclei from four independent animals. (C) TBPH and VCP mutant localization in A436S mutants (scoring is indicated below the representative images; n represents independent nuclei or muscles from four independent animals). Arrow indicates TBPH accumulation in the nucleolus. (D) VCP localization in wild type (WT) and P134L mutants (scoring is indicated below the representative images; n represents individual nuclei from four independent animals). Arrow indicates VCP aggregate. (E,F) VCP localization (E) and Lamin C staining (F) in the indicated genotypes. (G) Quantification of the percentage of nuclei displaying the nuclear envelope phenotype (n is indicated on the individual bars and represents individual nuclei scored from four independent animals). (H) Quantification of nuclei size for the indicated genotypes (n>50 nuclei from four independent animals). (I) Phalloidin staining for larval muscles displaying different degrees of defects, and quantification of the percentage of healthy, mild and severely defective muscles (n is indicated on the individual bars and represents individual muscles scored from five independent animals). Data are mean±s.e.m. **P<0.01, ***P<0.001, ****P<0.0001 (one-way ANOVA with Dunnett's multiple comparisons).

