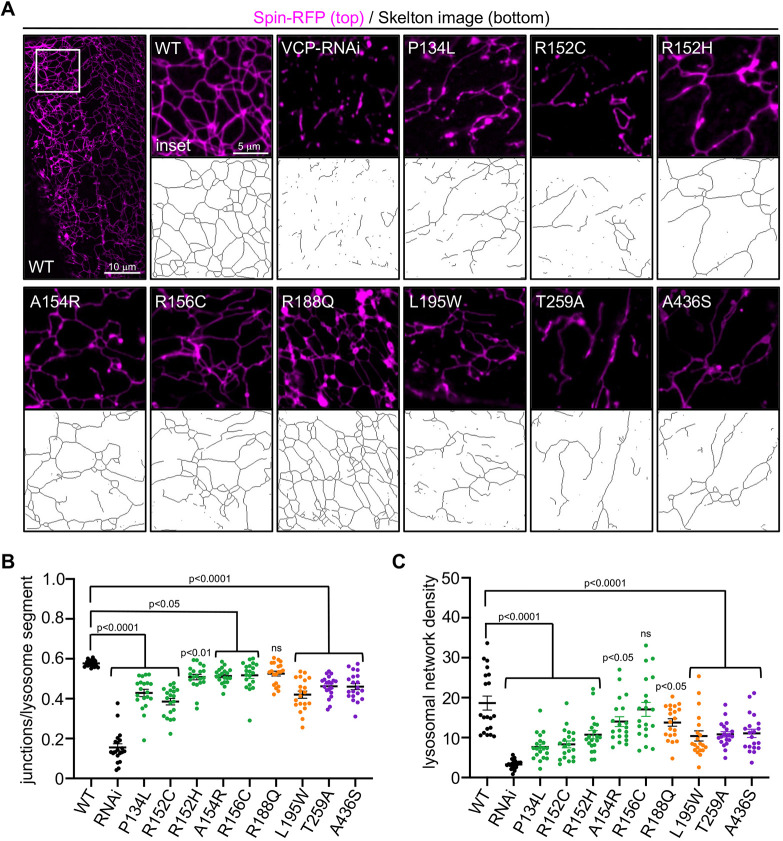
Fig. 7.
Tubular lysosomal network analysis in VCP disease models. (A) Representative images of lysosomes in the third instar larval body wall muscle of the indicated genotypes. Below each image is a representative skeleton image obtained using the Skeletonize plug-in in ImageJ for each of the indicated genotypes. (B,C) Quantification of network integrity (number of junctions/object) (B) and density (objects/µm2) (C) for the genotypes indicated. Data are mean±s.e.m. Statistical significance was determined using one-way ANOVA with Dunnett's multiple comparisons (P-values are indicated on the graphs, n=20 muscles from four independent animals). ns, not significant.

