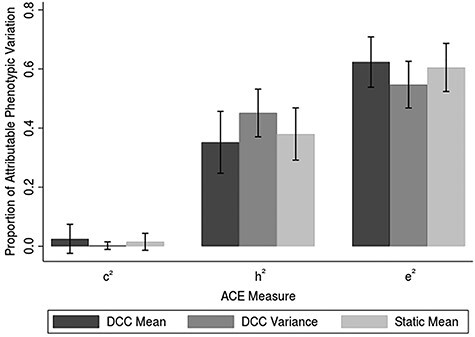
Figure 2 .

Relative contributions to connectivity measures. Bar graphs represent the averaged ACE measures across both sessions, with error bars reflecting standard deviation. For both sessions individually, heritability was higher for the DCC variance relative to DCC mean (session 1: t(20) = 2.20, P = 0.040; session 2: t(20) = 5.15, P = 4.88 × 10⁻⁵) and was higher for DCC variance relative to static connectivity (session 1: t(20) = 2.40, P = 0.026; session 2: t(20) = 2.87, P = 0.0095).Abbreviations: h2 = genetic variance, c2 = common environmental variance, e2 = unique environmental variance.
