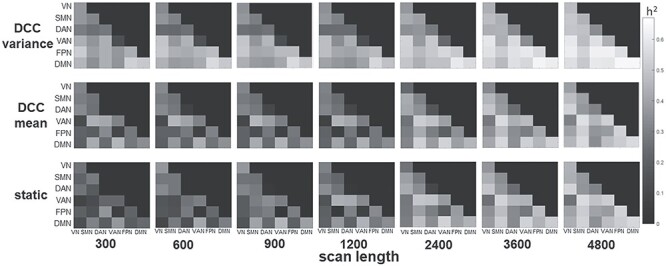
Figure 3 .

Heritability as a function of consecutive scan length. Connectivity values were computed for the first 300, 600, 900, 1200, 2400, 3600, or 4800 consecutive time points, resulting in 3.6, 7.2, 10.8, 14.4, 28.8, 43.2, or 57.6 min of data. The connectivity metrics were first computed over the consecutive scan length in each subject before performing APACE. Heritability based on consecutive scans required 2400–3600 time points (i.e., between 28 and 43 min of scanning) before the heritability measures became stable. This was the case for all 3 connectivity metrics although, as was consistently found in the current study, the DCC variability tended to result in higher heritability at all scan lengths, and required fewer time points to stabilize than DCC mean and static connectivity.
