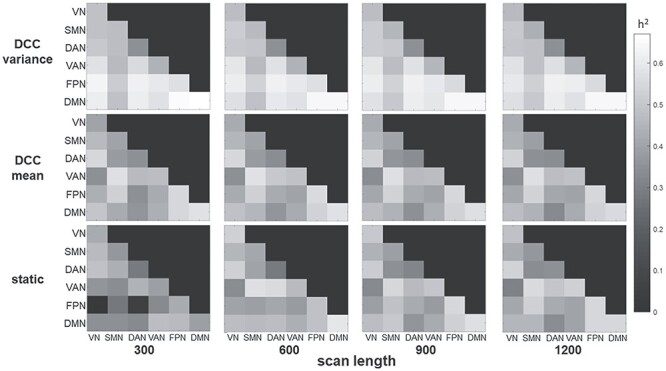
Figure 4 .

Heritability as a function of scan length averaged over 4 runs. Connectivity values were computed for the first 300, 600, 900, or 1200 time points of each run, resulting in 3.6, 7.2, 10.8, or 14.4 min of data per run (i.e., 14.4, 28.8, 43.2, or 57.6 min of data across the 4 runs). As with the primary analyses, the connectivity metrics were first computed within each run and then averaged across the 4 runs before performing APACE. Heritability values were generally stable across all scan lengths for the DCC metrics. Heritability values were tended to be lower for the scan length of 300 for static connectivity.
