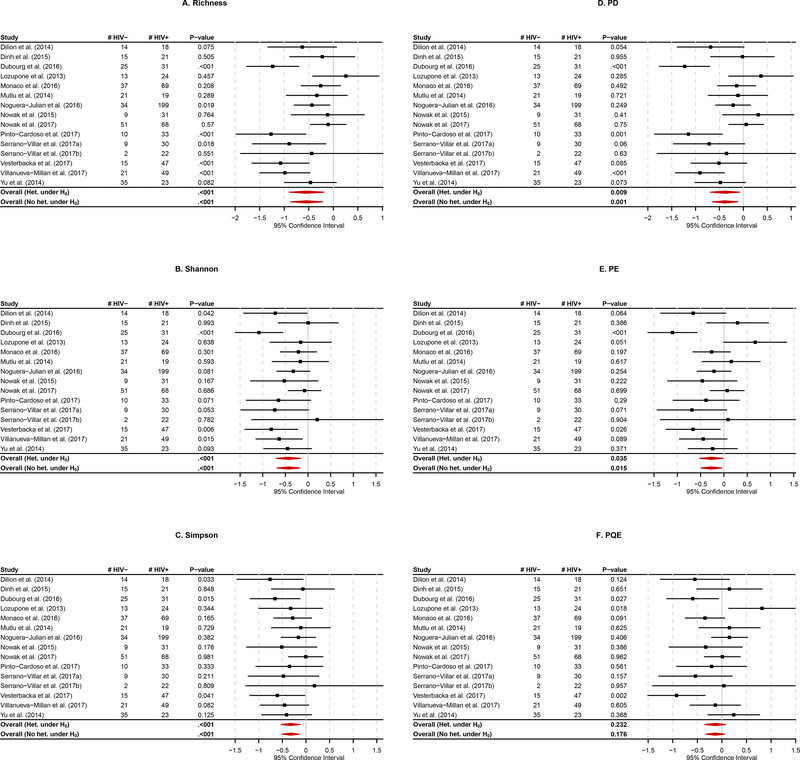
Figure 2. The forest plot: the results for each study on each α-diversity index, and the results for the single-marker meta-analyses based on the combination of the SJ estimator and the group permutation method to combine all the studies on each α-diversity index. A. Species richness; B. Shannon index; C. Simpson index; D. PD index; E. PE index; F. PQE index.
* Overall(Het. under H0) represents the traditional random effects meta-analysis for the existence of heterogeneity under H0, and Overall(No het. under H0) represents the Han and Eskin’s modified random effects meta-analysis for the assumption of no heterogeneity under H0.

