Fig. 3.

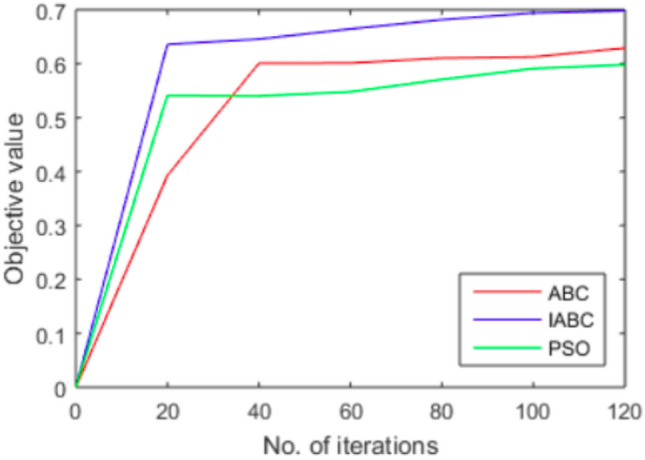
Performance of Artificial Bee Colony optimization algorithm through convergence. The x axis shows iteration count and y axis represents the corresponding objective function value generated by algorithm

Performance of Artificial Bee Colony optimization algorithm through convergence. The x axis shows iteration count and y axis represents the corresponding objective function value generated by algorithm