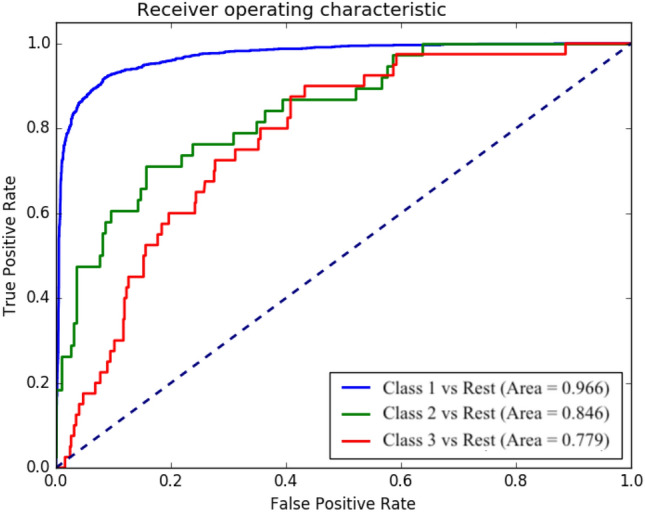
Fig. 6.

Performance plot of the logistic regression model for severity prediction. Here, class1, class2 and class3 indicate three severity levels, severity_mild, severity_moderate and severity_severe. Each curve corresponds to classification between a particular class and the remaining classes
