Figure 1:

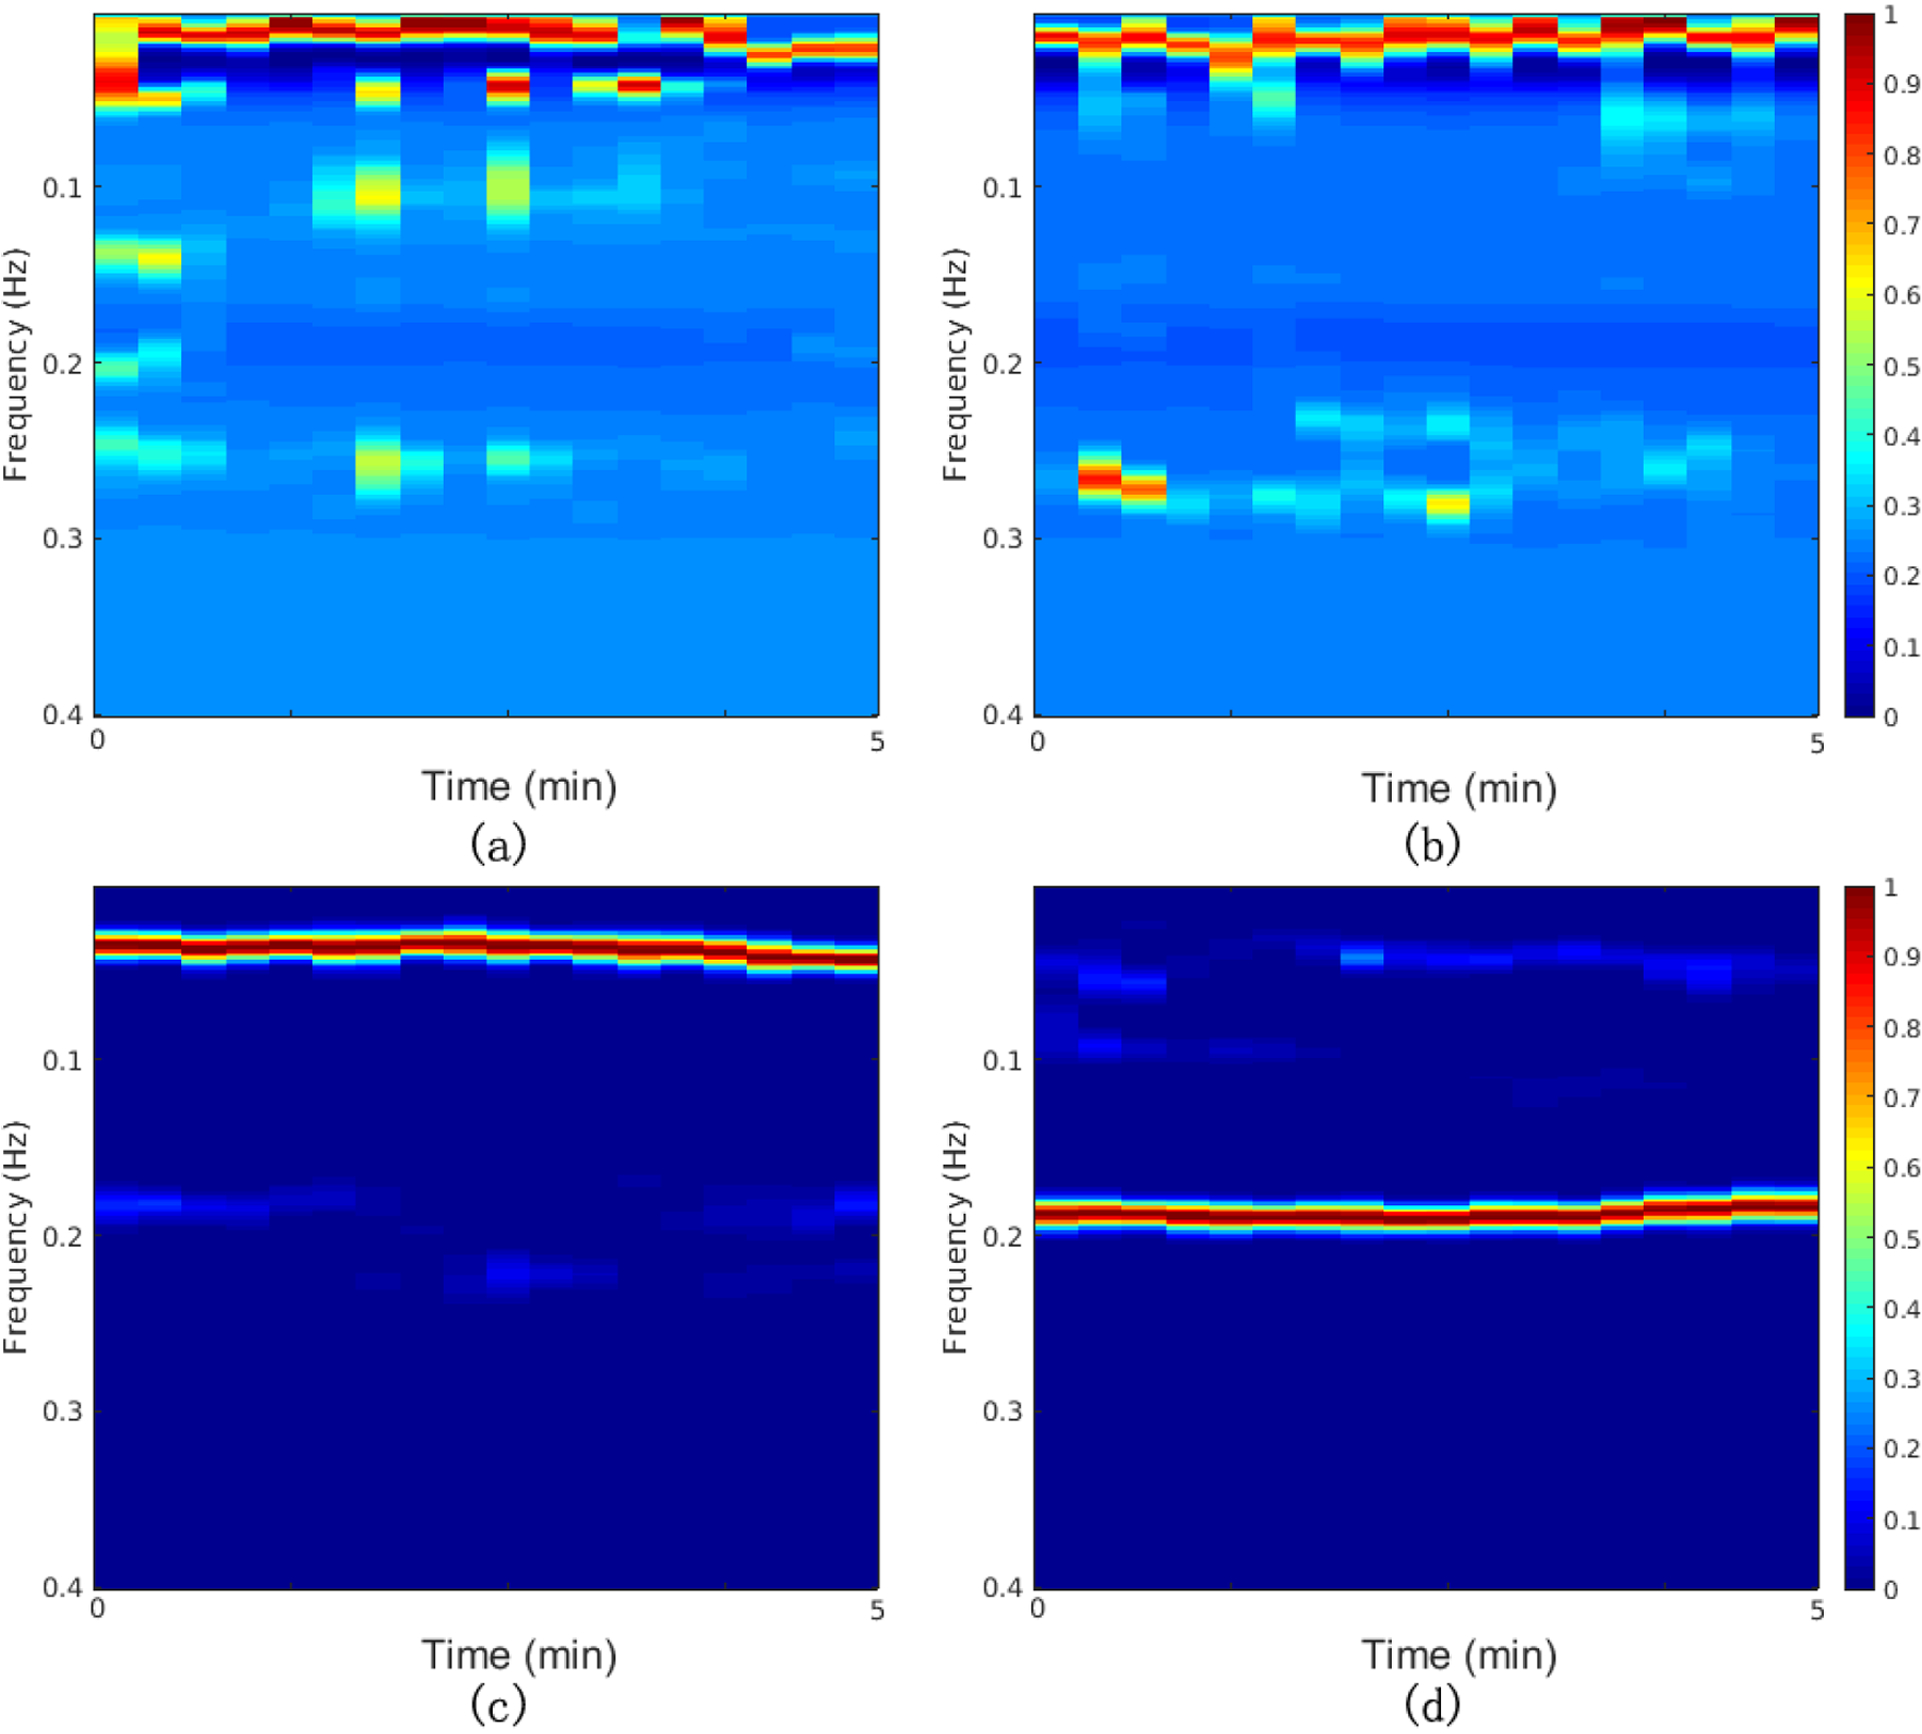
Examples of CRC spectrograms for each sleep state: (a) Wake; (b) REM sleep; (c) NREM light sleep; (d) NREM deep sleep. Hotter colors indicate higher cross spectral coherence (inherently normalized between 0 and 1)

Examples of CRC spectrograms for each sleep state: (a) Wake; (b) REM sleep; (c) NREM light sleep; (d) NREM deep sleep. Hotter colors indicate higher cross spectral coherence (inherently normalized between 0 and 1)