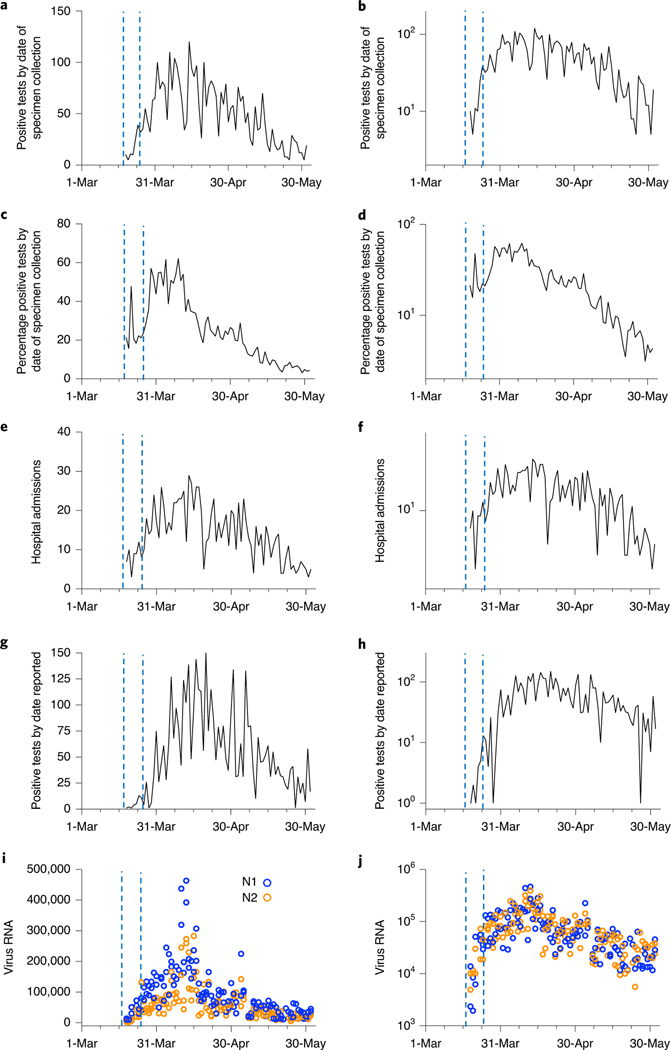
Fig. 2 |. Sludge SARS-CoV-2 RNA concentration time course and other COVID-19 outbreak indicators on linear (left) and log (right) scales.
All data represent the cities of New Haven, Hamden, East Haven and Woodbridge, Connecticut, which are served by the ESWPAF. The blue vertical dashed lines indicate the first week of analysis, March 19–25, 2020. a,b, Number of positive SARS-CoV-2 test results, reported by date of specimen collection. c,d, Percentage of positive SARS-CoV-2 test results, reported by date of specimen collection. e,f, Number of COVID-19 admissions to Yale New Haven Hospital for residents of the four cities. g,h, Number of positive SARS-CoV-2 test results by public reporting date. i,j, Primary sludge SARS-CoV-2 RNA concentration (virus RNA gene copies per ml of sludge).

