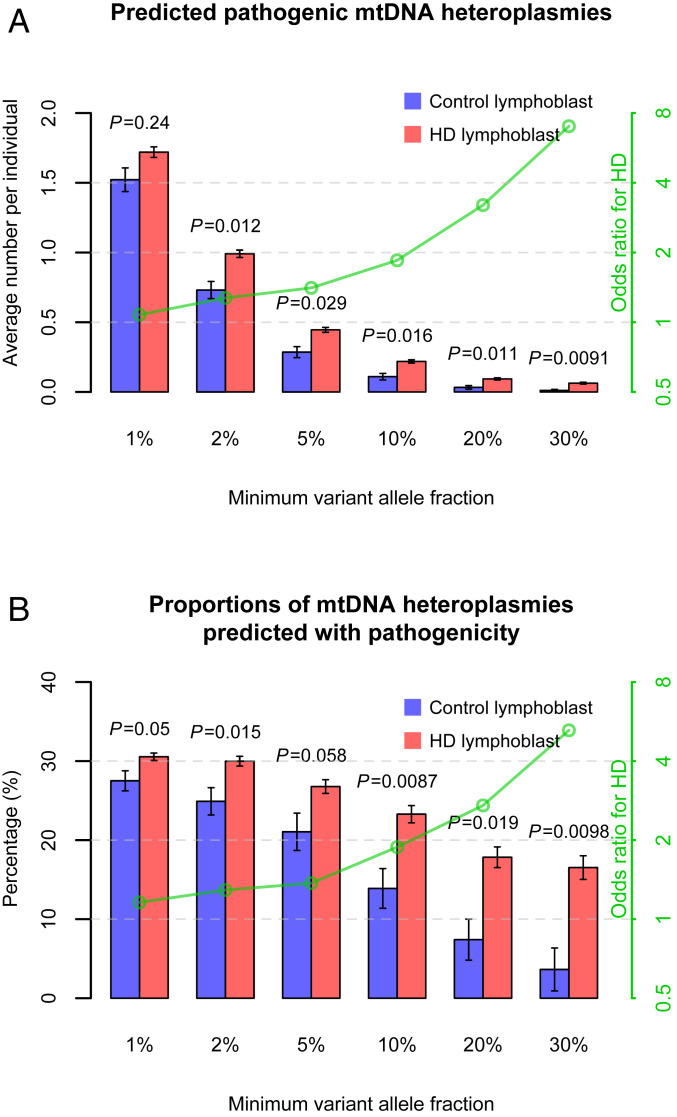
Fig. 1.
mtDNA variant incidence in lymphoblasts of HD patients and control individuals. The results are shown by using bars in A for average numbers of predicted pathogenic heteroplasmies per individual, and in B for proportions of mtDNA heteroplasmies that were predicted with pathogenicity, in lymphoblasts of HD patients and control individuals. The values on the x axes refer to the minimum VAF of the heteroplasmies used in the analyses, from a low fraction at 1% to a high fraction at 30%. Error bars represent SEM. SEM in B was estimated using 1,000 bootstrap resamples of control lymphoblasts or HD lymphoblasts. The P values for mtDNA heteroplasmies from the logistic regression analyses of the disease status are shown above the bars in A. The P values from Fisher’s exact test are shown above the bars in B. The effects of mtDNA heteroplasmies, as odds ratios for HD, are illustrated with the green lines indicated by the values on the green y axes on a logarithmic scale.

