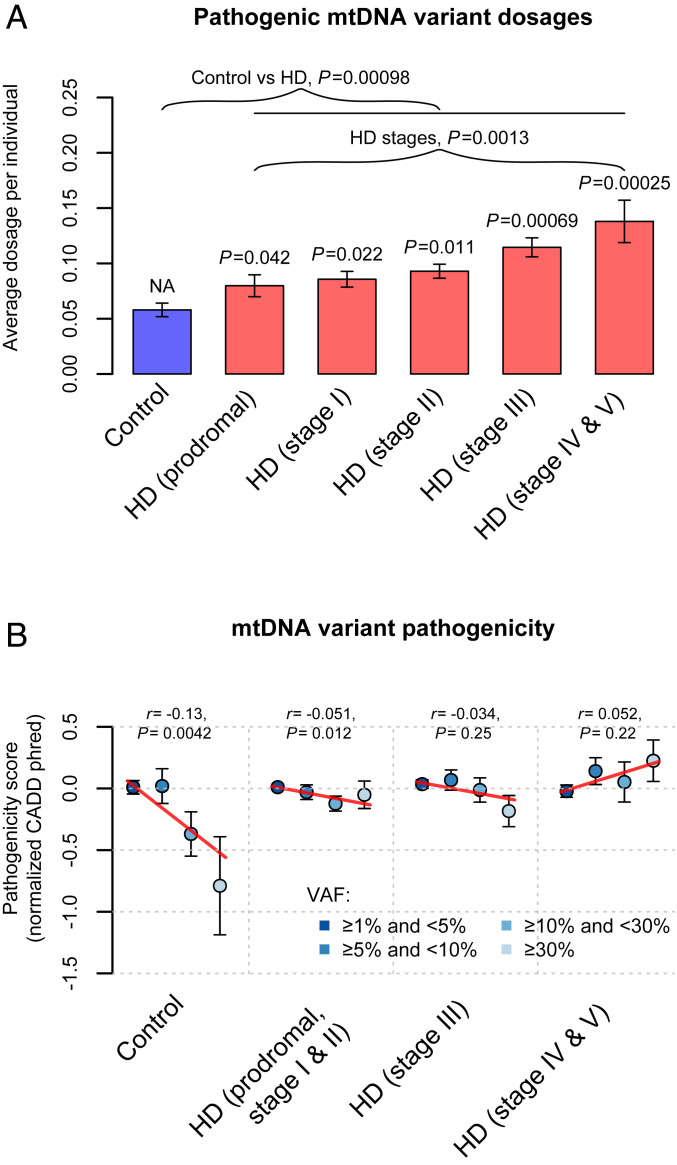
Fig. 2.
mtDNA variant dosages and pathogenicity in lymphoblasts of HD patients and control individuals. (A) Bar plots of the average variant dosages of predicted pathogenic heteroplasmies. The P values for mtDNA variant dosages from the logistic regression analyses of disease status are indicated above the bars representing the corresponding HD stages. In the linear regression analyses of disease stages, HD stages were treated as a continuous dependent variable with integer values from 1 to 5. NA, not applicable. (B) The average pathogenicity of nonsynonymous heteroplasmies stratified by their variant allele fractions (VAFs) in lymphoblasts. The dots representing different VAF categories were depicted by using colors indicated in the legend. Pearson’s r between the heteroplasmic VAF and the pathogenicity score, as well as the corresponding P value, are shown in each panel of B. The CADD scores are shown with the inverse normal transformed values, which increase with the chance of a heteroplasmy being pathogenic. The red lines in B represent the fitted regression lines for the VAF categories and the pathogenicity scores. NA, not applicable. Error bars in A and B represent SEM.

