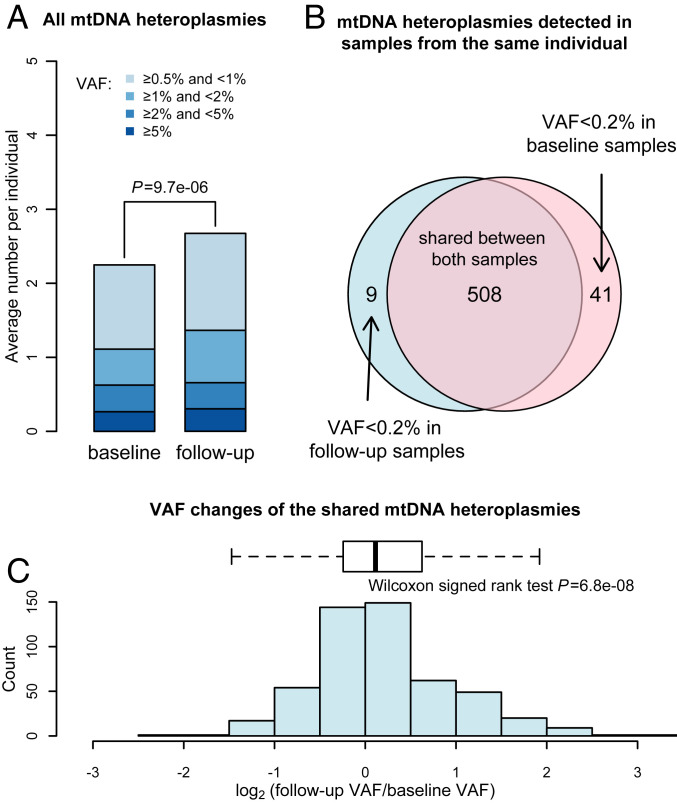
Fig. 4.
mtDNA variant incidence and fraction changes detected in longitudinal blood samples of HD patients. (A) Bar plots of the incidence of mtDNA heteroplasmies detected in the baseline and follow-up blood samples. The relative incidence of heteroplasmies in different variant allele fraction (VAF) categories was depicted using colors indicated in the legend. The P value from paired t test of the overall heteroplasmy incidence is shown. (B) Venn diagram of mtDNA heteroplasmies detected in samples from the same individuals. The light blue circle represents heteroplasmies identified in the baseline sample. The red circle represents heteroplasmies identified in the follow-up samples. The overlapping region shows the share of 508 mtDNA heteroplasmies with VAF ≥ 0.2% in both samples. (C) Histogram and box plots of the distribution of the VAF changes of the 508 shared mtDNA heteroplasmies during the follow-up.

