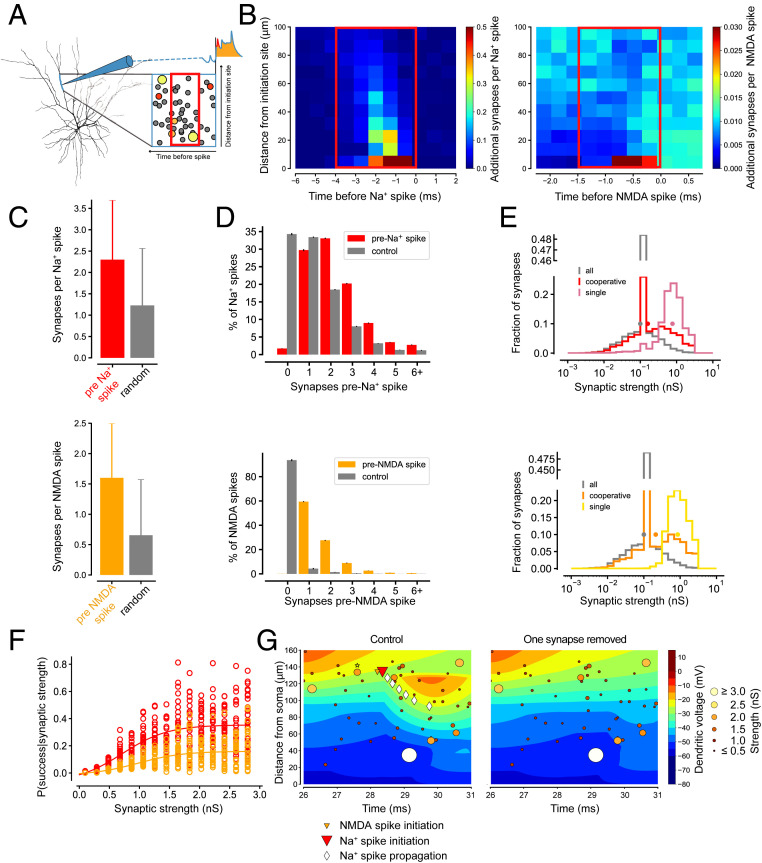
Fig. 5.
Surprisingly few synaptic inputs are required to trigger dendritic spikes. (A) Schematic of the spatiotemporal dendritic STA used in B. Circles of increasing diameter and increasingly “hot” colors indicate synaptic inputs with increasing synaptic strength (scale in G). (B) STA for dendritic Na+ spikes (Left) and dendritic NMDA spikes (Right), with the BG level of synaptic activity subtracted. Colormaps are clipped. Red rectangles indicate spatiotemporal windows for counting synaptic inputs in C. (C) Number of excitatory synaptic inputs active before dendritic Na+ spikes (mean ± SD; red, Top) and NMDA spikes (mean ± SD; orange, Bottom), compared to the number of active synapses in control spatiotemporal windows placed at random time points (gray; Materials and Methods). (D) Dendritic Na+ spikes (red, Top) and NMDA spikes (orange, Bottom) broken down by the number of synapses that triggered them. Gray bars show the distribution of the number of active inputs in control spatiotemporal windows. (E) Distribution of the strength of synapses activated preceding a random control timepoint (gray), dendritic Na+ spikes (Top, red colors), and NMDA spikes (Bottom, orange colors). For dendritic Na+ spikes and NMDA spikes, this distribution can be further split into cooperative trigger synapses (red and orange) and individual trigger synapses (magenta and yellow). The dots represent the mean values of the respective distribution. Note the peak at 0.1 nS resulting from BG synapses (w = 0.1 nS) that contribute to dendritic Na+ spikes and NMDA spikes. “Cooperative synapses” are synapses where more than one synapse was active in the spatiotemporal window preceding the dendritic spike, whereas if only a single synapse was active during this window, we call this an “individual trigger synapse.” (F) Average probability for a synapse to trigger a local dendritic Na+ spike (red) or NMDA spike (orange) as a function of synaptic strength. (G, Left) Snapshot of synaptic inputs across the dendritic tree (circles; brighter color indicates larger synaptic weight) contributing to the initiation of a dendritic Na+ spike. (Right) Silencing a strong trigger synapse (yellow circle at t = 27.6 ms, marked with a star on the Left) abolishes the dendritic Na+ spike. Contours are lines of equal membrane potential (maximum projection across all dendrites at this distance from soma, as in Fig. 3B).

