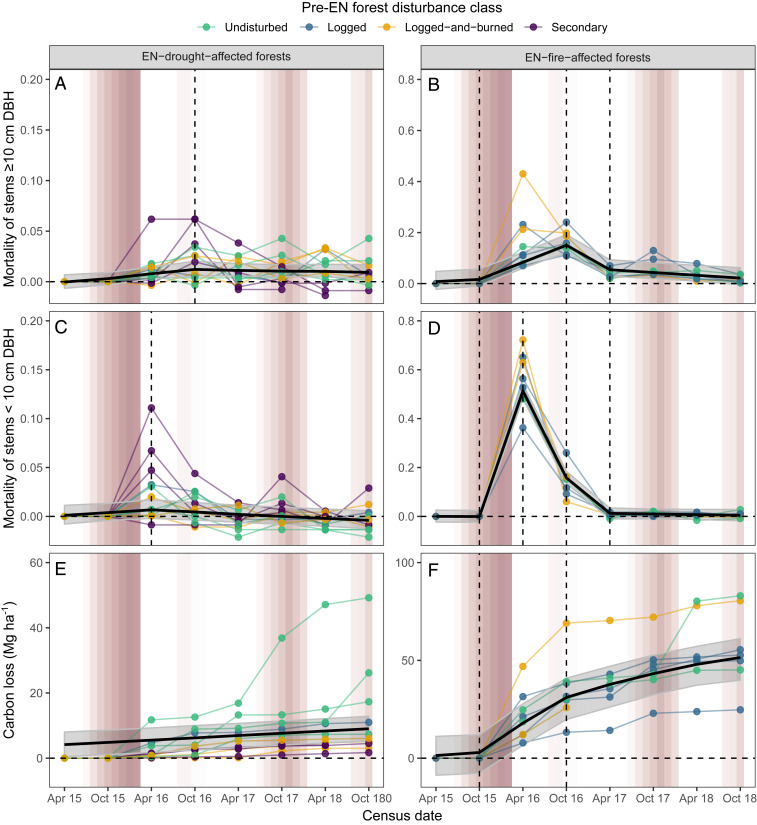
Fig. 1.
El Niño–driven carbon loss and plant mortality. Cumulative mortality of (A and B) stems ≥ 10 cm DBH and (C and D) stems 2 ≤ DBH < 10 cm; and (E and F) cumulative carbon loss between April 2015 and October 2018 in EN-drought–affected (A, C, and E) and EN-fire–affected forests (B, D, and F). Mortality was defined as the proportion of stems lost in census after discounting for baseline (i.e., pre-EN) levels of mortality (represented by the horizontal dashed line). Points show plot-level results and are colored by pre-EN forest disturbance classes. The solid black line shows the median estimate from the Bayesian piecewise linear change point model. The gray band shows the 95% credible interval. Vertical dashed lines show the changepoints (see Methods). The white/red background displays the CWD for the Lower Tapajós region from 0 (white) to −448 (dark red) mm.

