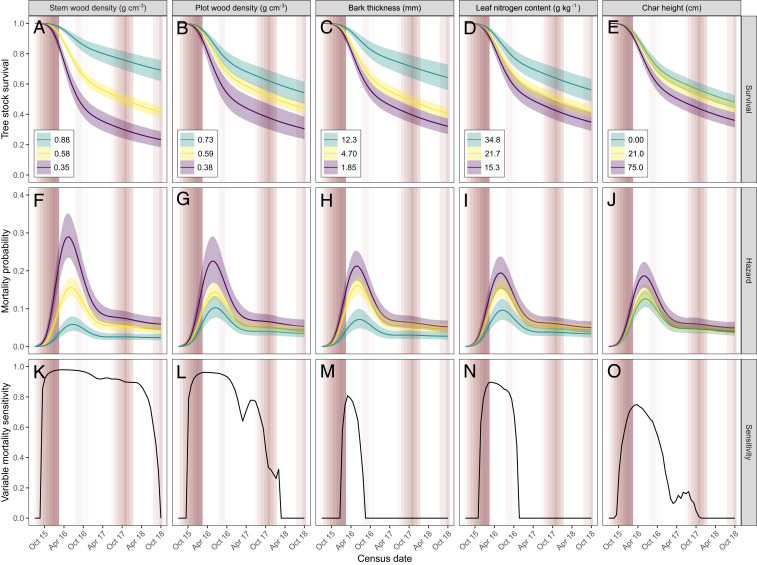
Fig. 2.
Physiological and ecological predictors of tree mortality during and after the 2015 to 16 El Niño. The five significantly important predictors influencing (A–E) the proportion of live trees from the initial stock, (F–J) the instantaneous mortality probability (i.e., hazard), and (K–O) the tree mortality sensitivity in relation to each predictor. The results are for forests affected by fire and drought during the 2015 to 16 El Niño, which were sampled between October 2015 to 2018. Tree survival and hazard are shown for the fifth, 50th, and 95th percentiles of the observed variable gradient, while other variables were held at their mean values. The solid lines show the median estimate, and the bands show the 95% credible intervals. Mortality sensitivity quantifies the change in a variable from its baseline levels required to return a substantial increase in stem mortality. The baseline levels were defined as the mean of each variable found across all trees in undisturbed forests before the onset of the El Niño (i.e., in the absence of both a climatic or anthropogenic disturbance). The median char height, however, was defined as the mean found in undisturbed forests after the El Niño fires. A value of 0 indicates that no change in the variable mean influenced tree mortality at a given time (i.e., the variable does not act as a predictor of mortality); a value of 1 indicates that any change in the variable returned a substantial mortality increase. Mortality sensitivity thus quantifies a variable’s time-varying importance (see Methods for full details). The white/red background displays the CWD for the Lower Tapajós region from 0 (white) to −448 (dark red) mm.

