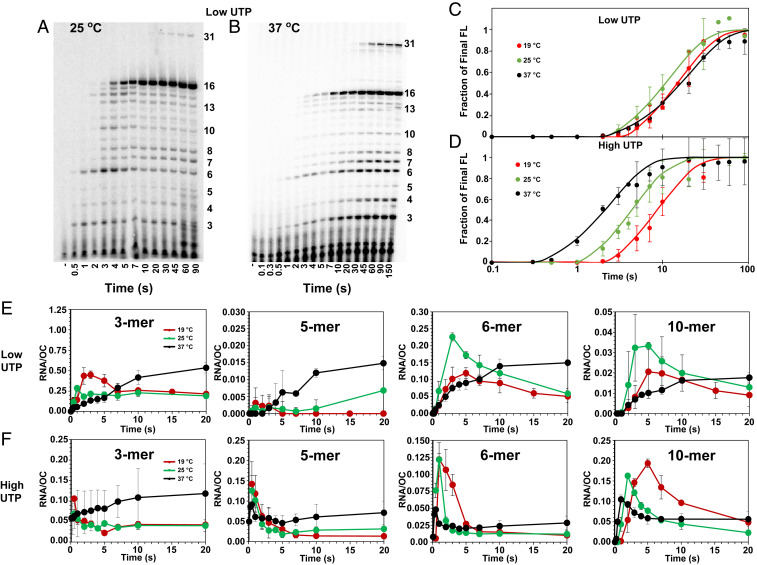
Fig. 2.
Step-by-step kinetics of transcription initiation from λPR promoter at different NTP concentrations and temperatures. (Top Left) PAGE separations of individual 32P-labeled RNA bands (from 3-mer to 16-mer and 31-mer) observed as a function of time during productive and nonproductive initiation at 25 (A) and 37 °C (B). Lanes span the time range from 0.5 to 90 s or 0.1 to 150 s after adding NTPs and heparin to OC formed by premixing RNAP and λPR-promoter DNA (SI Appendix, Methods). Gels shown are for the low-UTP condition: 200 μM ATP and GTP, 10 μM UTP, and 17.5 nM α-32P-UTP. CTP is omitted, causing transcription to pause at a 16-mer RNA, before readthrough occurs to synthesize longer transcripts (15). Representative high-UTP (200 μM ATP and UTP, 10 μM GTP, and 17.5 nM α-32P-GTP) gels at 25 and 37 °C are shown in SI Appendix, Fig. S1. (Top Right) Time courses (log scale) of synthesis of FL (>10-mer) RNA at 19 [red (15)], 25 (green), and 37 °C (black) at low UTP (C) and high UTP (D). (Bottom) Comparisons of linear time courses for representative short RNAs (3-mer, 5-mer, 6-mer, and 10-mer) synthesized by productive and nonproductive complexes at low UTP (E) and high UTP (F) at 19 [red (15)], 25 (green), and 37 °C (black). At each time point, the average amount of each RNA present (per OC) is shown with the estimated uncertainty.

