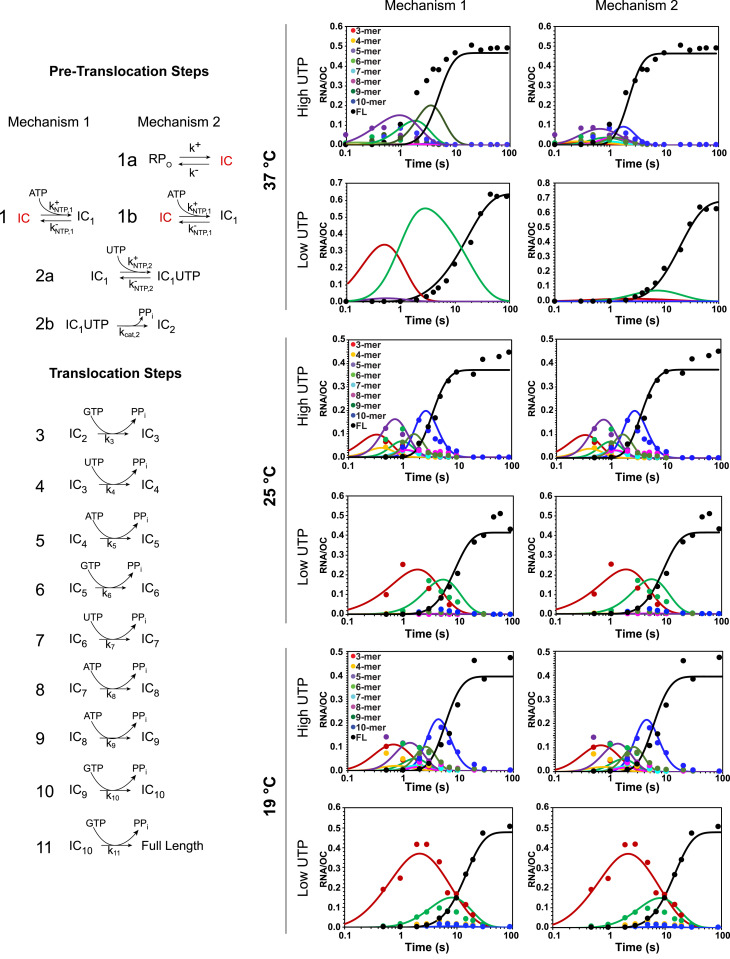
Fig. 3.
Fits of initiation kinetic data to step-by-step mechanisms. (Left) Two mechanisms differing in initial (pretranslocation) steps are shown. Mechanism 1, previously shown to describe λPR initiation data at 19 °C (15), is a minimal initiation mechanism for situations in which the stable OC is also the IC. Mechanism 2, proposed here to describe λPR initiation data at 37 °C in which the stable OC is RPO, includes an initial conformational change that converts RPO to the IC that binds NTP and productively initiates as in Mechanism 1. (Right) Comparison of fits (solid curves) to Mechanisms 1 and 2 of all λPR productive initiation data at 37, 25, and 19 °C for the two NTP conditions investigated (log time scale). Colors: 3-mer, red; 4-mer, yellow; 5-mer, purple; 6-mer, light green; 7-mer, light blue; 8-mer, pink; 9-mer, dark green; 10-mer, dark blue; and FL, black. The analyses of short RNA time courses (e.g., Fig. 2 E and F) to obtain the transients in FL RNA synthesis plotted here (points) are shown in SI Appendix, Figs. S3–S6. Rate constants ki, determined from these fits to Mechanism 2 at each temperature, are given in SI Appendix, Table S4.

