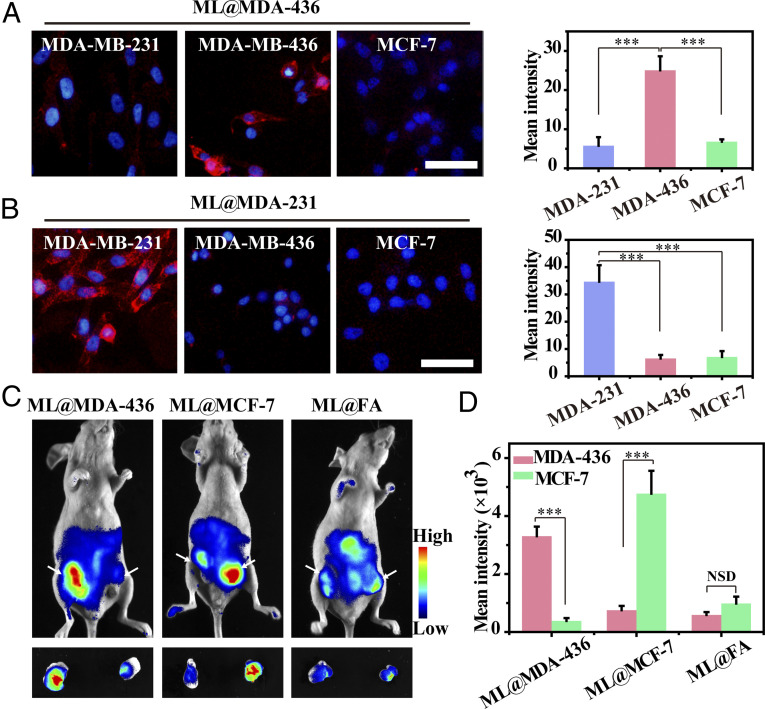
Fig. 6.
Selectively visualizing glycans of breast cancer subtypes. Fluorescence imaging and quantitative examination of diverse subtypes of breast cancer cells incubated with 50 µM (A) ML@MDA-436 and (B) ML@MDA-231, respectively. Subsequently, cells were labeled with DBCO-Cy5. Cell nucleus was stained with Hoechst (blue). (Scale bars: 50 μm.) A quantitative examination of fluorescence images was analyzed by ImageJ software. Data were displayed as average intensity (n = 10). (C) In vivo fluorescence visualization of mice with tumors administrated with ML@MDA-436 (60 mg ⋅ kg−1), ML@MCF-7 (60 mg ⋅ kg−1), and ML@FA (60 mg ⋅ kg−1) on 4 consecutive days. DBCO-Cy5 was intravenously injected into mice on day 5. (D) Quantitative analysis of the intensity from whole-body fluorescence imaging. Data are presented as mean ± SD (n = 3). Asterisks indicate significant differences (NSD: no significant difference, ***P < 0.001).

