
Fig. 3. mtDNA interacts with VDAC1 and stabilizes its oligomeric state.
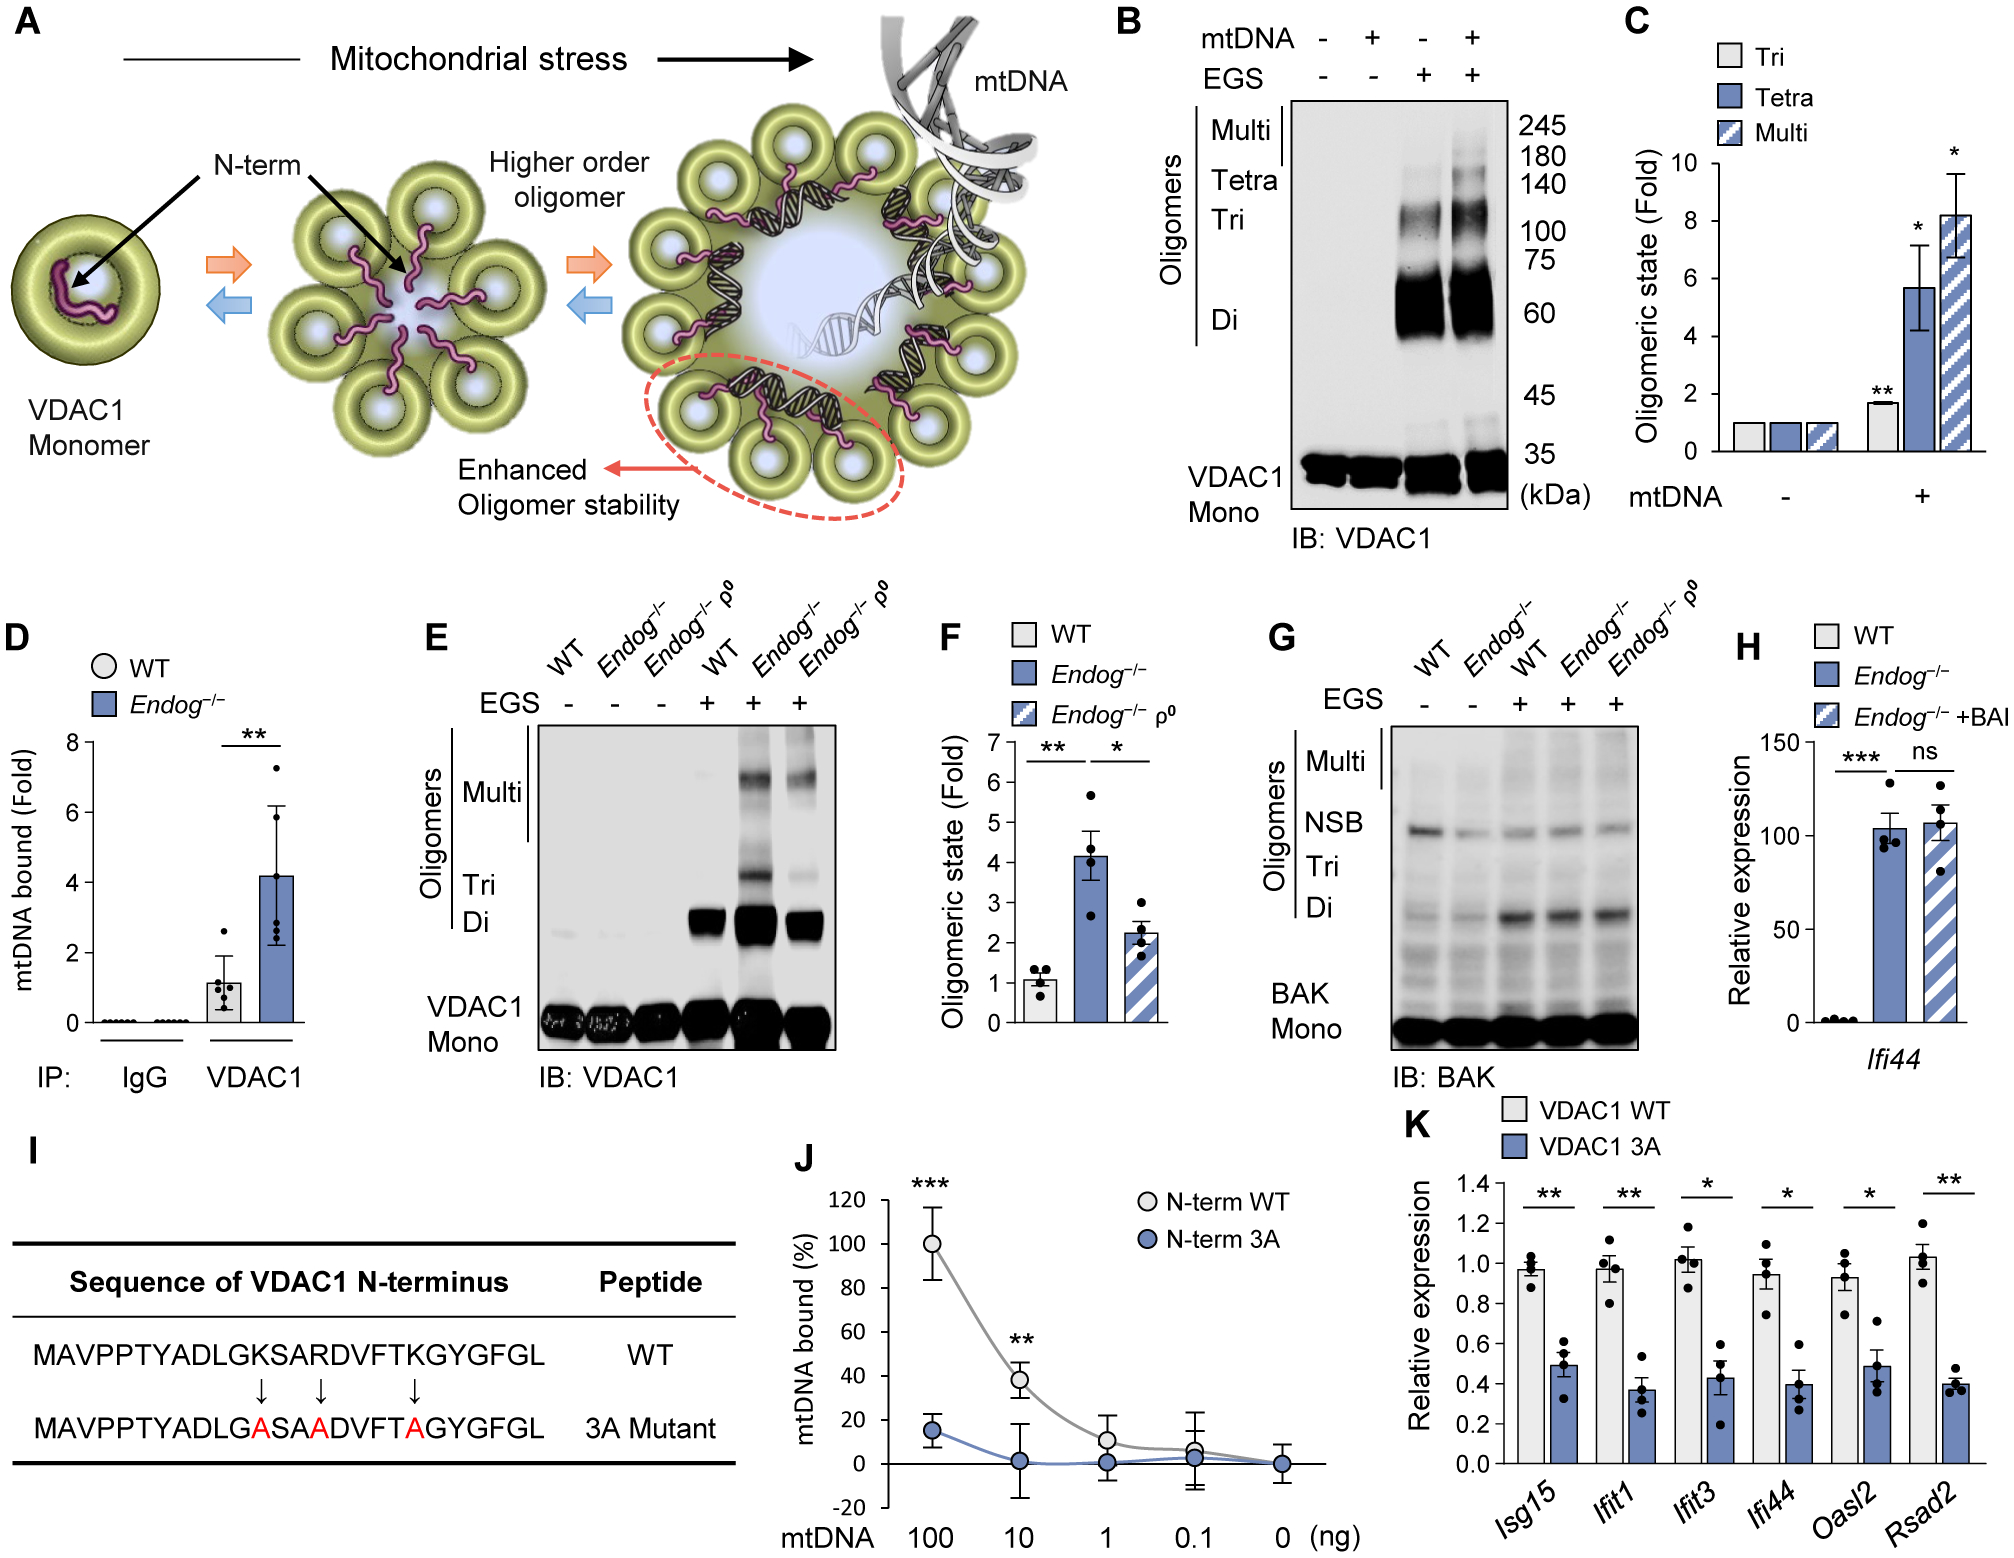
(A) Schematic diagram of VDAC1 oligomerization accompanied by the N-terminal domain (red) translocation into the large oligomer pore. We could not characterize VDAC3 in vitro because it tends to form aggregates. (B and C) mtDNA-induced oligomerization of purified VDAC1 was visualized by immunoblotting after treatment with the cross-linking reagent EGS to stabilize the oligomers during electrophoresis (B). Quantitative analysis of oligomers is shown (C). (D) mtDNA binding to VDAC1 in WT and Endog−/− MEFs. (E to G) VDAC1 (E) and BAK (G) oligomerization in WT, Endog−/− and Endog−/− ρ0 MEFs was visualized by immunoblotting. The positions of VDAC1 monomers (Mono), dimers (Di), trimers (Tri) and multimers (Multi) are indicated. NSB, non-specific band. Quantitative analysis of VDAC1 oligomers is shown (F). (H) ISG expression was measured in WT and Endog−/− MEFs after treatment with the BAX oligomerization inhibitor (BAI) (2 μM) for 24 h. (I) The amino-acid sequence of the VDAC1 N-terminal peptide. The positively charged amino acids were mutated to alanine (A: red color). (J) Direct interaction of mtDNA fragments with WT and 3A N-terminal 26 amino-acid peptides. (K) ISG expression levels were measured by RT-qPCR after H2O2 (100 μM) treatment for 18 h in MEFs expressing either WT or 3A VDAC1. All values are presented as the mean ± SEM of at least three independent experiments. *p < 0.05; **p < 0.01; ***p < 0.005; ns, not significant.