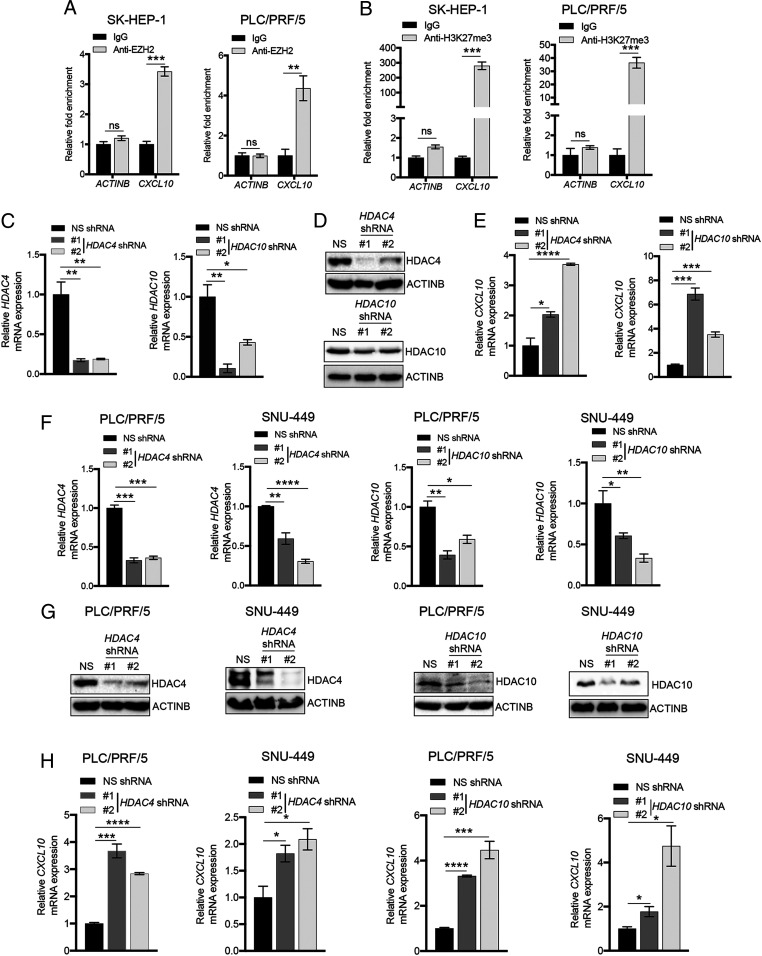
Fig. 3.
HDAC4 and HDAC10 are necessary for CXCL10 repression in hepatic tumor cells. (A) EZH2 recruitment to the CXCL10 and ACTINB promoters was measured in SK-HEP-1 and PLC/PRF/5 cells using ChIP assays. Relative fold enrichment of EZH2 on the CXCL10 and ACTINB promoters compared to IgG control is plotted for the indicated cell lines. (B) The H3K27me3 modification on the CXCL10 and ACTINB promoters was measured using ChIP assays. Relative fold enrichment compared to IgG control is plotted. (C) Relative mRNA expression of HDAC4 (Left) and HDAC10 (Right) measured by qRT-PCR in SK-HEP-1 cells expressing HDAC4 or HDAC10 shRNAs or nonspecific (NS) shRNA control. ACTINB expression was used for normalization. (D) Immunoblot analysis to measure the indicated proteins in SK-HEP-1 cells expressing NS, HDAC4, or HDAC10 shRNAs. (E) Relative CXCL10 mRNA expression measured by qRT-PCR in SK-HEP-1 cells expressing NS, HDAC4, or HDAC10 shRNAs. ACTINB expression was used for normalization. (F) Relative mRNA expression of HDAC4 and HDAC10 measured by qRT-PCR in PLC/PRF/5 and SNU-449 cells expressing NS, HDAC4, or HDAC10 shRNAs. ACTINB expression was used for normalization. (G) Immunoblot analysis to measure the indicated proteins in PLC/PRF/5 and SNU-449 cells expressing NS, HDAC4, or HDAC10 shRNAs. (H) Relative CXCL10 mRNA expression measured by qRT-PCR in PLC/PRF/5 and SNU-449 cells expressing NS, HDAC4, or HDAC10 shRNAs. ACTINB expression was used for normalization. Data are presented as the mean ± SEM; ns, not significant; *P < 0.05, **P < 0.01, ***P < 0.001, and ****P < 0.0001.

