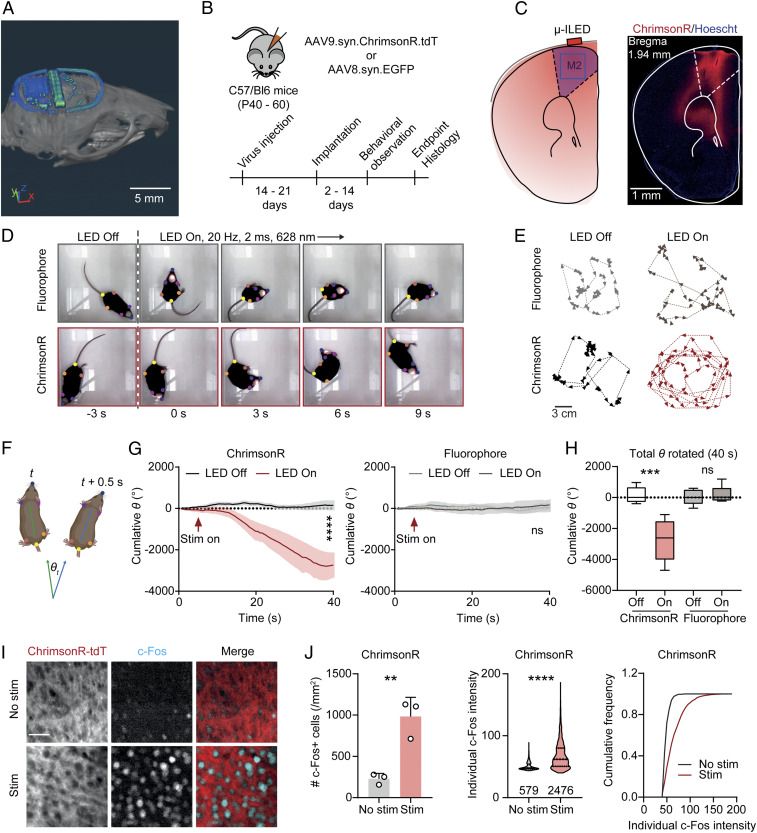
Fig. 5.
Transcranial optogenetic stimulation in M2 drives rotational behavior. (A) CT image of a subdermally implanted device on the skull of a mouse (Scale bar: 5 mm). (B) Schematic of virus transduction and experimental timeline. (C) Schematic of transcranial optogenetic stimulation in M2 and an example image of ChrimsonR expression (Scale bar: 1 mm). (D) Example frames across a 9-s long stimulation episode. Colored dots show the body positions tracked using Deeplabcut. (E) Example traces of mice expressing fluorophore or ChrimsonR with or without transcranial optogenetic stimulation (Scale bar: 3 mm). (F) Schematic illustrating the calculation of rotation degree (θ) for each frame (0.5-s bin). (G, Left) Summary data showing the cumulative rotation degrees in mice expressing ChrimsonR during a 40-s long episode. Two-way ANOVA, LED Off versus LED On (column effect), P < 0.0001. (Right) Same as Left but for mice expressing control fluorophore. Two-way ANOVA, LED Off versus LED On (column effect), P = 0.2074. n = 5 mice/group. (H) Summary data showing the total degrees rotated in each experimental condition. One-way ANOVA, F(3, 16) = 14.90, P < 0.0001, Sidak’s multiple comparisons, LED Off versus On: ChrimsonR, P < 0.0001, fluorophore, P = 0.9621. n = 5 mice/group. (I) Example images of c-Fos staining in M2 of mice expressing ChrimsonR-tdT with or without transcranial optogenetic stimulation (Scale bar: 50 µm). (J) Summary data showing the number of c-Fos neurons in individual mice (Left), the distribution of individual c-Fos particle intensities (Middle), and cumulative frequency of c-Fos particle intensities (Right). Two-tailed unpaired Student’s t test, No stim versus Stim: no. c-Fos+ cells, P = 0058; individual c-Fos intensity, P < 0.0001. n = 3 mice/group. Data represent mean ± SEM; the lines in the box and violin plot show quartiles and median. **P < 0.01, ***P < 0.001, ****P < 0.0001.

