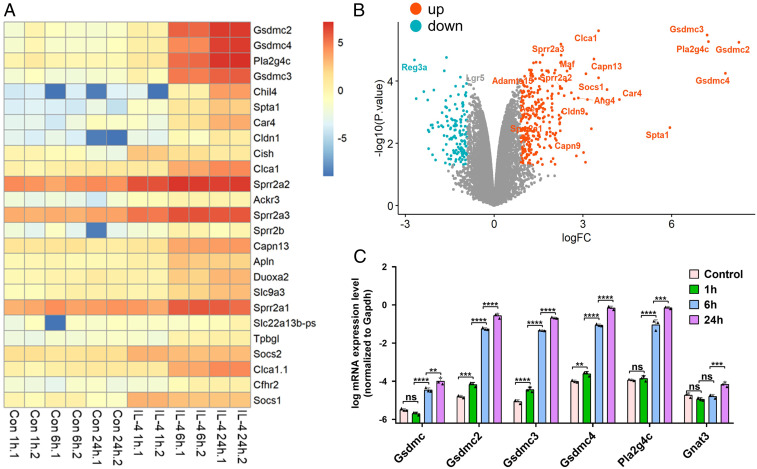
Fig. 1.
Up-regulation of Gsdmcs in intestinal organoids treated with the type 2 cytokine IL-4. (A and B) RNA-seq analyses of organoids treated with IL-4. (A) Heat map showing the top 25 up-regulated genes 1, 6, and 24 h after IL-4 stimulation (100 ng/mL) versus unstimulated controls (Con). Two biological replicates for each time point. (B) Volcano plot showing the fold change and P value of up-regulated (red) and down-regulated (blue) genes 24 h after IL-4 stimulation (100 ng/mL) versus unstimulated controls. x-axis: log fold change (FC). Cutoff for logFC is 0.9. (C) qPCR confirmation of the up-regulation of Gsdmc, Gsdmc2, Gsdmc3, Gsdmc4, Pla2g4c, and Gnat3 1, 6, and 24 h after IL-4 stimulation (100 ng/mL). **P < 0.01; ***P < 0.001; ****P < 0.0001; NS, not significant. Data (mean ± SEM) are technical replicates. qPCR experiments were repeated two more times with similar results.

