Fig. 3.
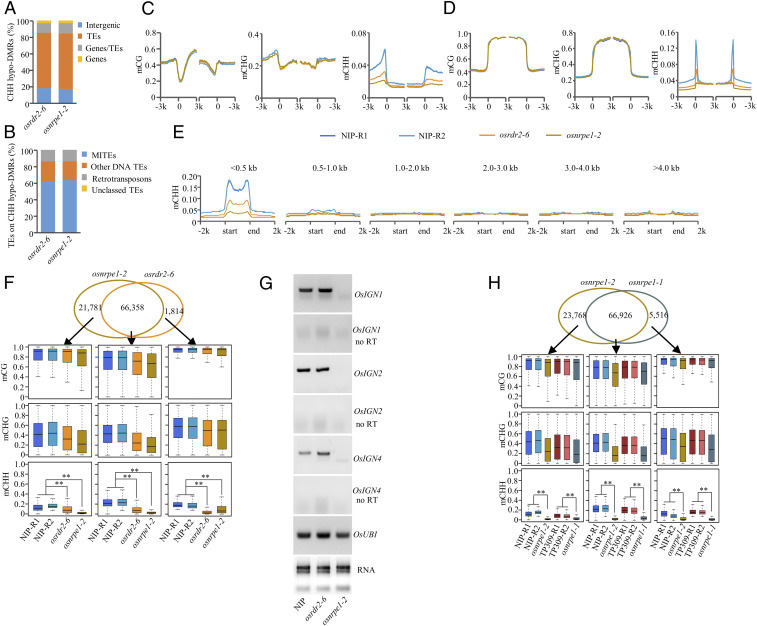
OsNRPE1 controls genome-wide CHH methylation. (A) Genomic location of CHH hypo-DMRs in osrdr2-6 and osnrpe1-2. (B) TE categories associated with CHH hypo-DMRs in osrdr2-6 and osnrpe1-2. (C and D) DNA methylation levels of CG, CHG, and CHH on genes (C) and on TEs (D) in Nipponbare, osrdr2-6, and osnrpe1-2. The average methylation levels within each 100-bp interval are plotted. (E) CHH methylation levels on TEs of different lengths in Nipponbare, osrdr2-6, and osnrpe1-2. (F, Top) Venn diagram showing the overlap of CHH hypo-DMRs in osrdr2-6 and osnrpe1-2. (Bottom) DNA methylation levels of CG, CHG, and CHH in the indicated genotypes on osrdr2-6–specific, osnrpe1-2–specific, and overlapped CHH hypo-DMRs as indicated by box plots. ** indicates that compared plots are significantly different at P < 0.01 (Fisher’s LSD). (G) RT-PCR analysis of Pol V–dependent transcripts on loci OsIGN1, OsIGN2, and OsIGN4 in Nipponbare and in the osrdr2-6 and nrpe1-2 mutants. (H, Top) Venn diagram showing the overlap of CHH hypo-DMRs in osnrpe1-2 and osnrpe1-1. (Bottom) DNA methylation levels of CG, CHG, and CHH on osnrpe1-2–specific, osnrpe1-1–specific, and overlapped CHH hypo-DMRs as indicated by box plots. ** indicates that compared plots are significantly different at P < 0.01 (Fisher’s LSD).

