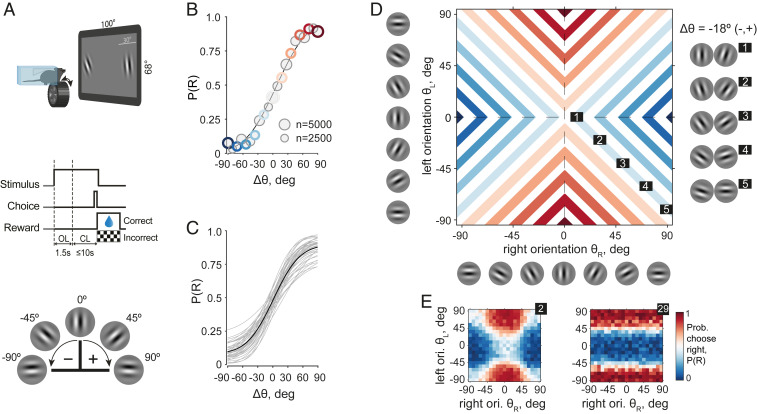
Fig. 1.
Mice were trained in an invariant orientation discrimination task. (A, Top) Schematic of a mouse during an experimental session. (Middle) Epochs of one trial. OL: open loop, during which the wheel manipulator did not move the stimuli on the screen. CL: closed loop, during which the wheel manipulator did move the stimuli. (Bottom) Convention for the angle signs. (B) Psychometric curve of an example animal. Solid line: best fit of the cumulative Gaussian psychometric function. Circles: data points, circle sizes represent numbers of trials, colors correspond to colors in D, and gray circles are data points not explicitly marked in D. (C) Psychometric curves for all animals in the study. Solid black line: population average. (D) Many orientation pairs give the same task-relevant information quantified by angular separation or difficulty (). Conditions with a fixed in the 2D stimulus space (colored lines) correspond to conditions (circles) of the same color in B. (Right) Five example stimuli for one of the four branches of constant = −18° ( ≤ 0, ≥ 0). (E) Probability of right choice of example animals 2 (Left) and 29 (Right) in the stimulus space as in D. Reference SI Appendix, Fig. S3 for other examples.

