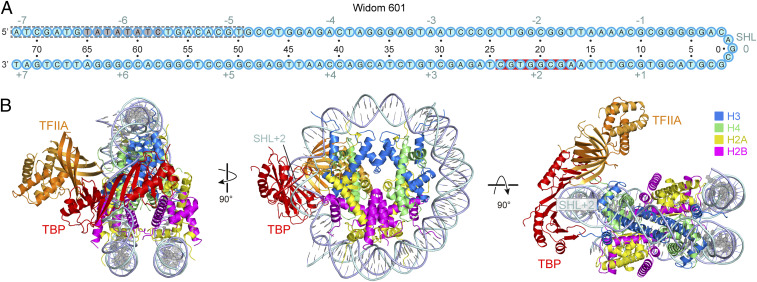
Fig. 3.
Structure of TBP–TFIIA–nucleosome complex with TBP located at SHL +2 (TBP–TFIIA–NCPSHL+2). (A) Cartoon depiction of the Widom-601 sequence. The TATA box-like sequence is highlighted in gray. Red background indicates observed TBP–DNA contacts. The gray dashed lines indicate the region of detached terminal DNA upon binding of TBP–TFIIA at SHL +2 position. Cyan numbers indicate SHL positions on the nucleosome with the central base pair denoted as SHL 0. Black numbers indicate nucleotide positions with respect to the SHL 0. (B) Three views of the overall structure.

