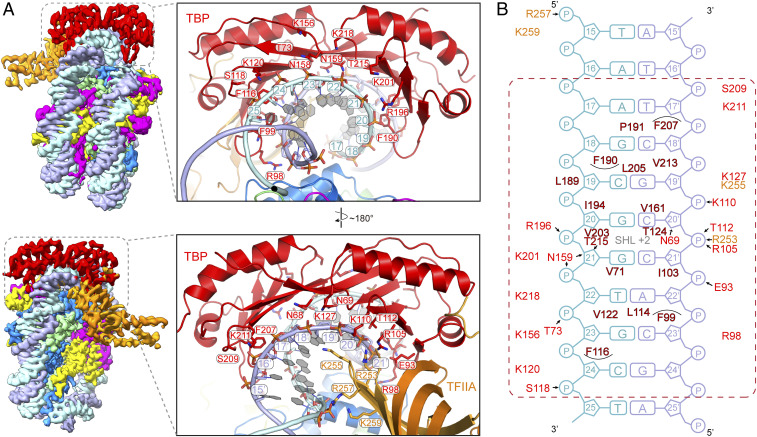
Fig. 4.
Protein–DNA interface in the TBP–TFIIA–NCPSHL+2 structure shows how TBP binds to GC-rich DNA. (A) Two views onto the edge of the nucleosome are shown on the Top and Bottom that are related by a 180° rotation around a vertical axis. On the Left, the cryo-EM maps are shown. On the Right, protein residues involved in DNA interactions are shown as stick models. (B) Schematic representation of protein–DNA interactions. Putative hydrogen bonds are shown as arrows. Residues from TBP and TFIIA are colored in red and orange, respectively. Residues involved in hydrophobic interactions are in dark red. The dashed red rectangle indicates the 8 bp involved in TBP contacts (compare Fig. 3A).

