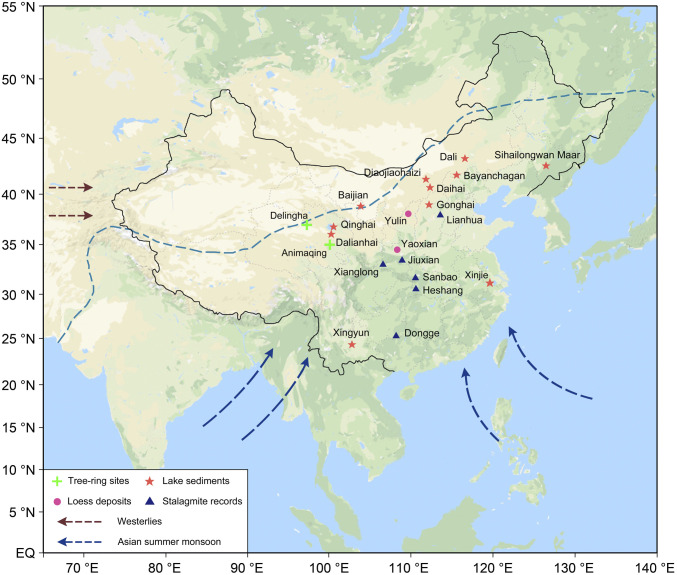
Fig. 1.
Locations of Holocene paleoclimate records included in this study. The arrows depict the ASM and the Westerlies. The blue dashed line indicates the approximate present-day northern extent of the ASM region based on the observed mean 2 mm/d summer isohyet after ref. 52. The blue triangles represent stalagmite records, the purple dots indicate loess-paleosol profiles, the red asterisks indicate lake sediment records, and the green crosses indicate tree-ring chronologies (including DLH). See SI Appendix, Table S6 for details about each paleoclimate record.

