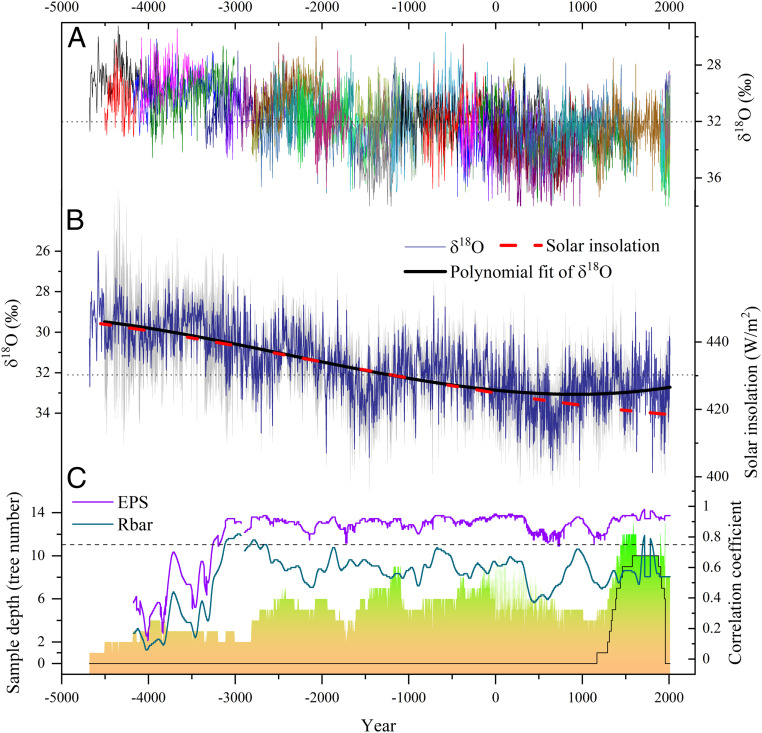
Fig. 2.
The DLH tree-ring δ18O chronology. (A) Visualization of all 44 δ18O measurement series. (B) DLH δ18O chronology (navy blue line), third-order polynomial fitting of this chronology (thick black line), and July solar insolation between 30°N and 60°N (red line). The gray shading indicates the 95% CI of the composite δ18O chronology. For better comparison, the y-axis of the δ18O chronology was reversed. (C) Sample depth (with the black line indicating the number of trees in the pooled series) of the DLH δ18O chronology and Rbar (gray line) and EPS (purple line) of the δ18O dataset, calculated over a 250-y window in steps of 1 y. The Rbar time series was smoothed with a 100-y Gaussian-weighted filter. The annual values with EPS ≥ 0.85 accounts for 80.2% during 3250 BCE to 2011 CE, whereas 91.2% of values have EPS ≥ 0.25 and 37.7% are ≥ 0.50 before 3250 BCE.

