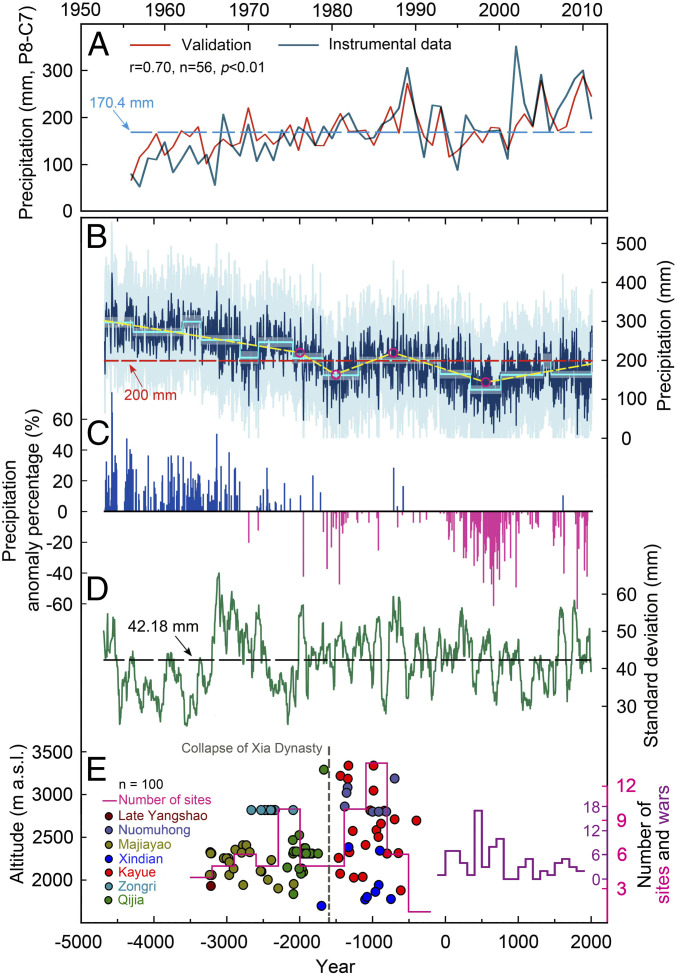
Fig. 3.
Annual (prior August to current July) tree-ring δ18O precipitation reconstruction ranging from 4680 BCE to 2011 CE. (A) Comparison between reconstructed (red) and instrumental (blue) precipitation (1956 to 2011 CE). The horizontal dashed line indicates the annual mean precipitation (170.4 mm) over the instrumental period (1956 to 2011 CE). (B) Reconstructed precipitation (blue) and 95% CIs (light blue shading). The sky-blue step lines represent regime shifts, and the associated shading indicates 95% CIs for each subperiod (SI Appendix, Materials and Methods). Significant changes in temporal trends (yellow line, with magenta circles indicating trend change point years with P < 0.05: 544 CE, 709 BCE, 1501 BCE, and 2000 BCE; SI Appendix, Materials and Methods). The red horizontal line is the reconstructed mean precipitation of the entire period (4680 BCE to 2011 CE). (C) Extreme dry and wet annual events 4680 BCE to 2011 CE. The events were identified in the precipitation reconstruction as those years in which the precipitation exceeded the 10th and 90th percentiles of the whole period and expressed as percent anomalies from the instrumental period mean. (D) The 100-y running SD of the reconstructed mean annual precipitation. (E) Prehistoric cultural responses to rapid climatic change on the northeastern TP and in northern China (47, 53). The dots of different colors indicate calibrated accelerator mass spectrometry dates of charred grains and bones unearthed from Neolithic and Bronze sites on the northeastern TP, while the pink step line represents temporal variations of number of dated sites every 300 y. The purple step line denotes variations of war frequency over time in east Qinghai Province during the past two millennia (32, 33).

