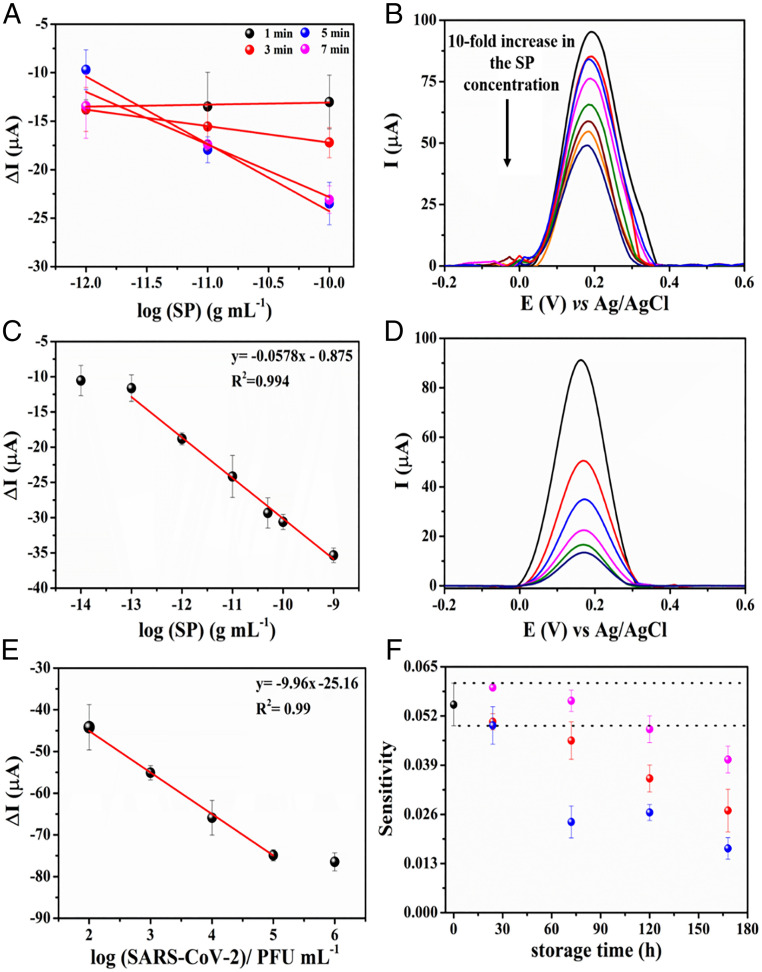
Fig. 4.
Kinetic study of the interaction between SARS-CoV-2 SP and LEAD. (A) Calibration curves built using SP at concentrations ranging from 1 × 10⁻¹² g⋅mL−1 to 1 × 10⁻¹⁰ g⋅mL−1 and using different incubation times (ranging between 1 and 7 min). Increased analytical sensitivities were achieved after 5 min (6.94 × 10⁻³ ± 1.00 × 10⁻³) and 7 min (5.42 × 10⁻³ ± 6.30 × 10⁻³). Thus, 5 min was chosen as the optimal incubation time for LEAD. All measurements were recorded in triplicate, and each measure was done using a different sensor. (B) Baseline-corrected SWVs for the 5.0 mmol⋅L−1 [Fe(CN)6]3−/4− redox probe after the electrode incubation with different concentrations of SP ranging from 1 × 10⁻¹⁴ to 1 × 10⁻⁹ g⋅mL−1. (C) Linear regression for the analytical curve constructed using the suppression current signal. Conditions: frequency, 80 Hz; amplitude, 70 mV, and step, 8 mV. All experiments were carried out in triplicate (n = 3), using 5.0 mmol⋅L−1 [Fe(CN)6]3−/4− containing 0.1 mol⋅L−1 KCl as the supporting electrolyte after exposure of the electrode to 50 µL of standard SP solution for 5 min. (D) Baseline-corrected SWV plots for tittered-inactivated viral solutions at concentrations ranging from 102 to 106 PFU⋅mL−1 in VTM. (E) Linearized correlation between the ΔI values and concentration of inactivated virus in solution. The analytical curve was carried out in triplicate measurements using different LEAD devices. (F) Stability study under different storage conditions: 25 °C (black circles), −20 °C (red circles), and stored dry at 4 °C (blue circles) and stored at 4 °C in PBS medium (pH = 7.4) (magenta circles) over 7 d. Sensitivity values were obtained by analytical curves in the concentration range from 1 × 10⁻¹² g⋅mL−1 to 1 × 10⁻⁹ g⋅mL−1 of SP. All experiments were carried out in triplicate (n = 3).

