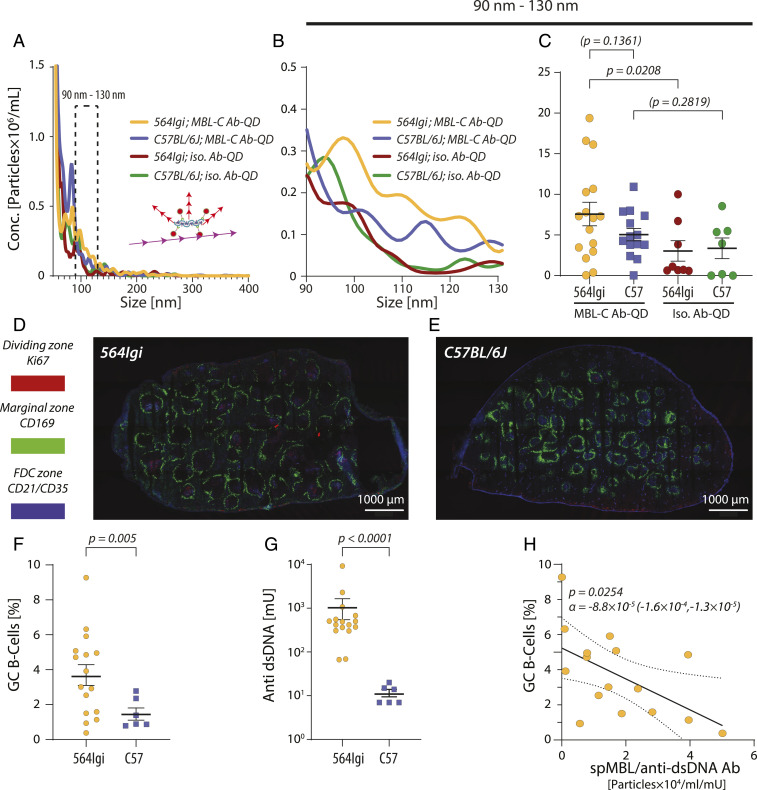
Fig. 5.
spMBL-C in 564Igi mice with SLE-like disease and correlation with GC B cell formation. (A–C) MBL-C or isotypic Ab-QDs were mixed with plasma from 564Igi (n = 16) or C57BL/6J (n = 14) mice and characterized by NTA (A). Statistically significant differences were tested for the size interval 90 to 130 nm (B) in a two-tailed t test with Welch’s correction. Solid lines indicate mean value and error bars SEM (C). (D and E) Confocal microscopy of GCs in the spleens of 564Igi and C57BL/6J mice. The marginal zone (CD169+ macrophages), dark zone (dividing centroblasts positive for Ki67), and follicular dendritic cell (CD21/CD35+) zones were stained. Images were made by 4 × 7 tile scans acquired with a 10× objective at 512 × 512 (D) or 1,024 × 1,024 (E) pixel resolution using 10% overlap for each tile scan. (F and G) Quantification of GC B cells (F) and anti-DNA Abs (G) in 564Igi (n = 16) and C57BL/6J (n = 6) mice. Statistical significance was tested in a two-tailed Welch’s t test (F) or in a Mann–Whitney U test (G). (H) Correlation between GC B cell percentage and the ratio of spMBL and anti-dsDNA Abs concentrations. A linear correlation was calculated according to the expression α · [spMBL]/[Anti-dsDNA Abs] + β for 16 564Igi mice. The linear regression is indicated with a solid line, the CI is shown with dotted lines, and the P value states the likelihood of α = 0.

