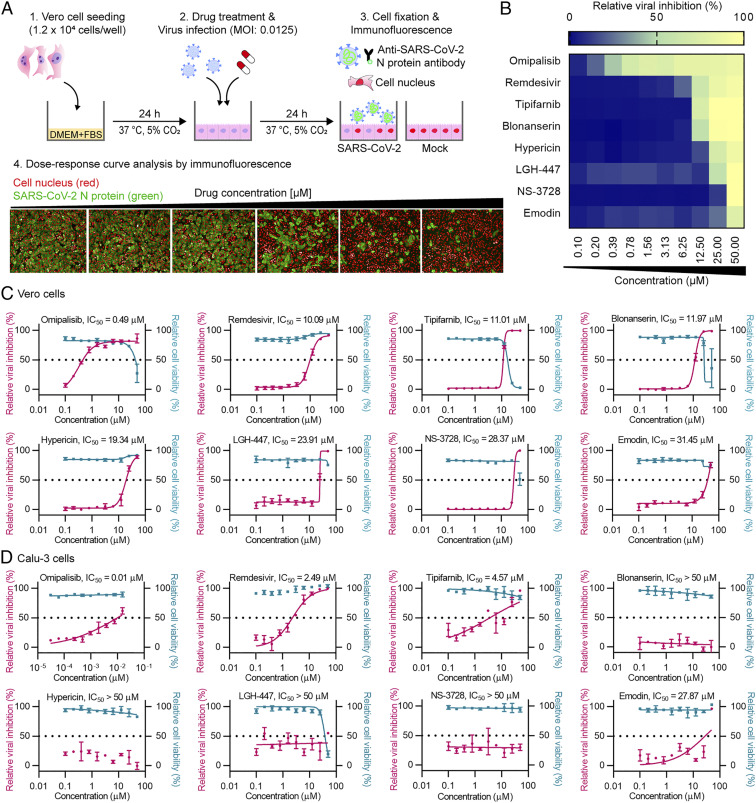
Fig. 3.
Dose–response analysis for the compounds having anti–SARS-CoV-2 activity. (A) A schematic of the immunofluorescence-based assay to examine anti–SARS-CoV-2 activity in Vero cells using the compounds selected from virtual screening. (B) A heatmap representing the percentages of normalized infection of the eight compounds in dose–response, on a scale from 0 to 100, depicting the average of duplicate independent experiments. Dose–response curves of the potent compounds in Vero cells (C) and Calu-3 cells (D). Pink line indicates relative viral inhibition and the blue line indicates relative cell viability. Data are normalized to the average of DMSO-treated wells and shown as the mean ± SD of duplicate independent experiments.

