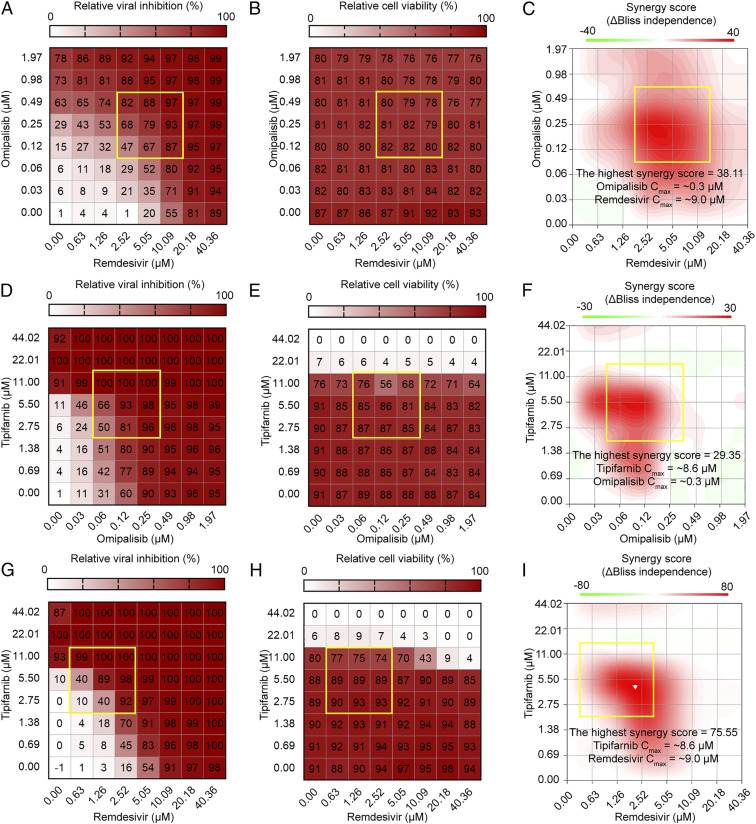
Fig. 4.
Analyses of drug combinations on anti–SARS-CoV-2 activity, cell viability, and their synergistic effects. Two-dimensional matrix of dose–response for relative viral inhibition: (A) omipalisib/remdesivir, (D) tipifarnib/omipalisib, and (G) tipifarnib/remdesivir. The heatmap depicts relative viral inhibition scaled to the range of 0 to 100%. Two-dimensional matrix of dose–response for relative cell viability: (B) omipalisib/remdesivir, (E) tipifarnib/omipalisib, and (H) tipifarnib/remdesivir. The heatmap depicts relative cell viability scaled to the range of 0 to 100%. Topographic two-dimensional map of synergy scores determined by synergyfinder using the data in A, D, and G, respectively: (C) omipalisib/remdesivir, (F) tipifarnib/omipalisib, and (I) tipifarnib/remdesivir. The synergy map highlights synergistic and antagonistic dose regions in red and green colors, respectively. A yellow box represents the area with the highest synergy score obtained by synergyfinder.

