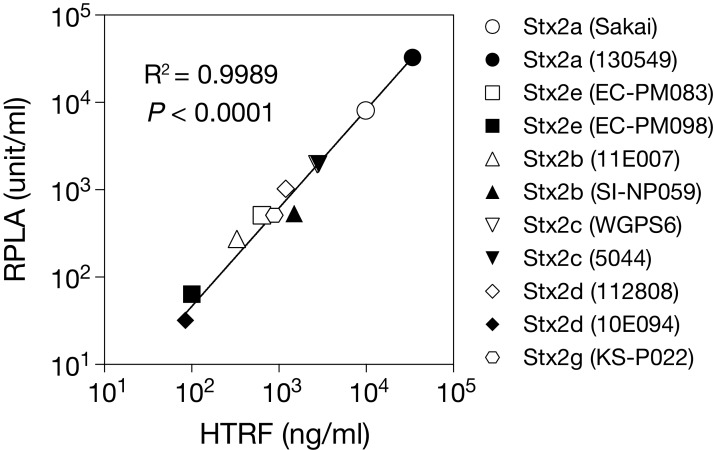
Figure 3. Relationship between the Stx2 concentrations estimated by the HTRF and RPLA assays.
The concentration of Stx2 produced by each STEC strain (shown in parentheses) was measured by HTRF and RPLA assays. Each plot represents the mean values of Stx2 concentrations determined by three independent HTRF assays (X-axis) and the RPLA unit obtained from a single assay (Y-axis). Each value is shown in Table 1. See Methods for the definition of units in the RPLA assay. Note that rabbit anti-Stx2 pAb was used in the RPLA assay. Both axes are displayed in logarithmic scale. The solid line represents the nonlinear regression. The correlation between the data from the two assay systems was evaluated using the Pearson correlation coefficient, as shown in the graph.

