
Figure 10. Structural basis for ATP inhibition of AK3.
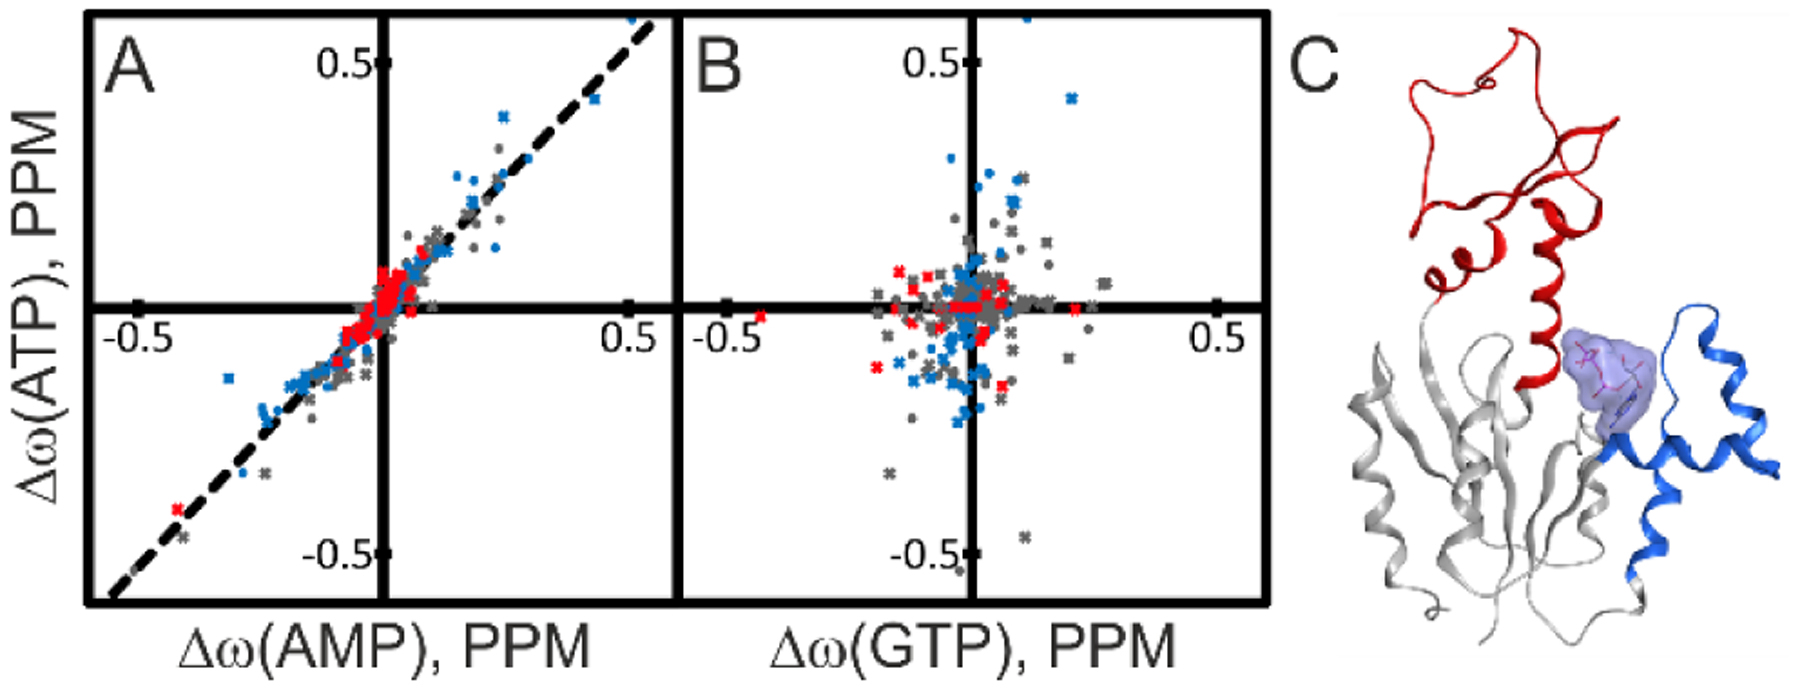
The spatial location of ATP binding to AK3 was identified from comparisons of chemical shift perturbations induced by ATP with those induced by AMP and GTP. (A) Correlation between chemical shift perturbations induced by ATP and AMP. The identity of residues in the AMP binding (red), GTP binding (blue) and core sub-domains (gray) are indicated in the plot. The best fitted linear correlation is indicated with the straight line (Δω(ATP)=1.06* Δω(AMP), R2: 0.93). The strong linear correlation indicates that ATP binds to the AMP binding site of AK3. (B) Comparison of ATP and GTP induced chemical shift perturbations with color-coding as in (A). The lack of correlation excludes the possibility that ATP binds to the GTP binding site. (C) 1.75 Å co-crystal structure of AK3 in complex with ATP. ATP binds to the AMP biding site as predicted from the NMR results in (A) and (B). The GTP and AMP binding sites are colored in blue and red, respectively.