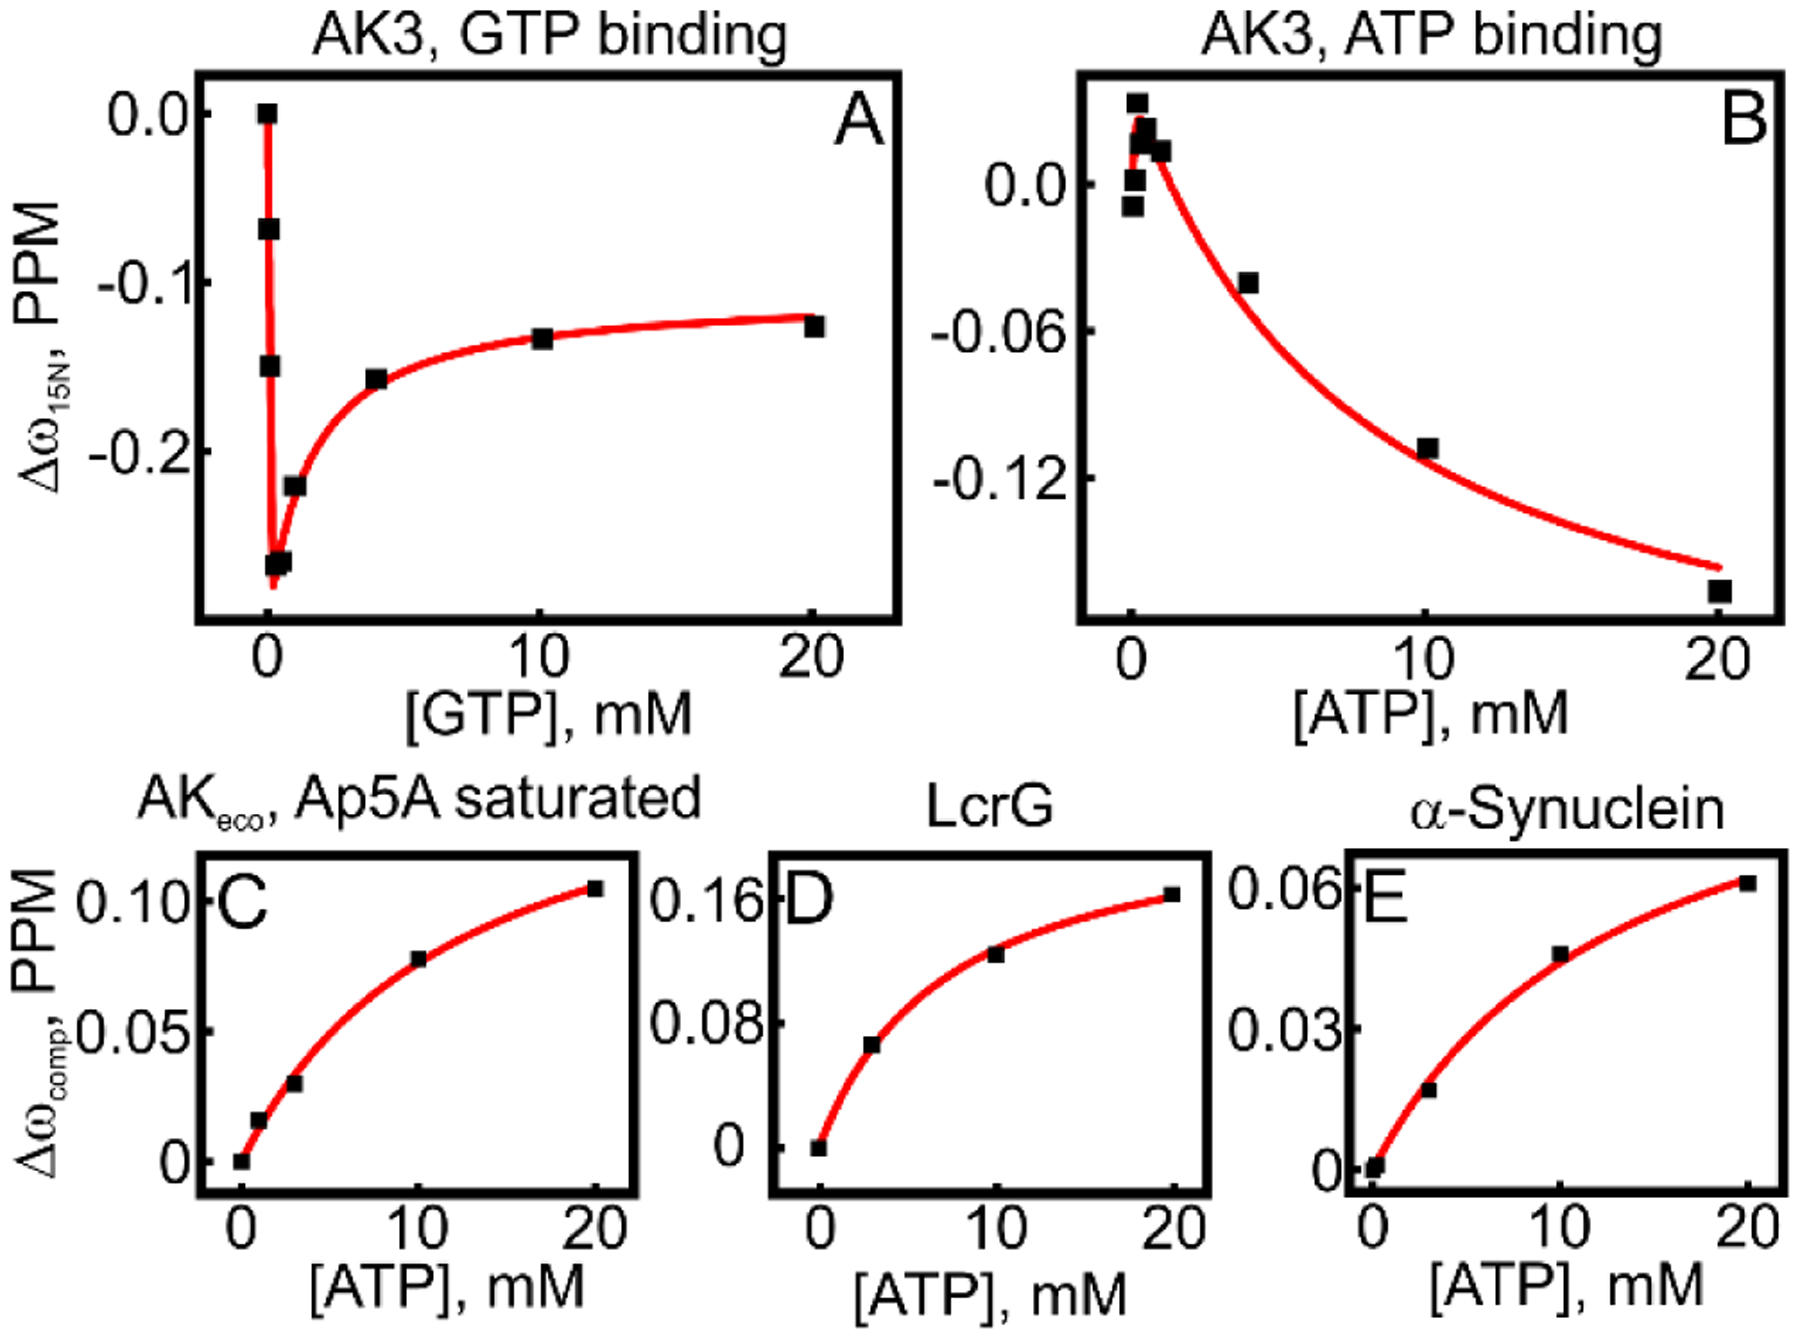
Figure 7. Non-specific binding of GTP and ATP to protein surfaces.

Weak binding affinities of GTP to AK3 and ATP to three different proteins, in addition to AK3, were quantified with NMR spectroscopy. In all panels the GTP or ATP induced chemical shift perturbations for one example amino acid residue are shown against the ATP/GTP concentration. (A) and (B) GTP and ATP binding curves to AK3 fitted to a two-site model (equation 4) are shown by the red line. (C) ATP binding to AKeco where the endogenous ATP and AMP binding sites have been occluded by presence of excess of the tight binding inhibitor Ap5A. (D) ATP binding to the Yersinia pseudotuberculosis protein LcrG. (E) ATP binding to the human protein α-synuclein. In C-E the best fitted one-site model (equation 3) is shown as a solid red line.
