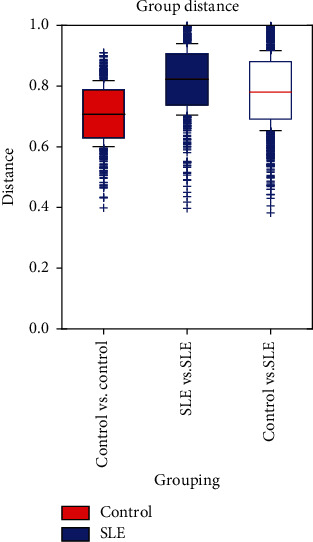
Figure 1.

Bray-Curtis statistical algorithm was used to calculate the distance between each sample and obtain the distance matrix. The distance between the SLE group and the HC group with quartiles was calculated, and a box diagram of the distance between the two groups was drawn to compare the distance distribution differences. Student's two-sample t-test method was used to compare the distance between each group.
