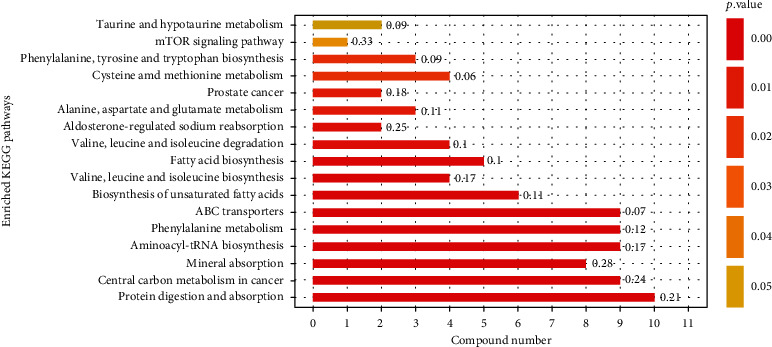
Figure 4.

KEGG pathways. Numbers on the right of the bar are rich factor, reflecting the degree of enrichment (rich factor = the number of genes enriched in this pathway/the number of all genes in this pathway).

KEGG pathways. Numbers on the right of the bar are rich factor, reflecting the degree of enrichment (rich factor = the number of genes enriched in this pathway/the number of all genes in this pathway).