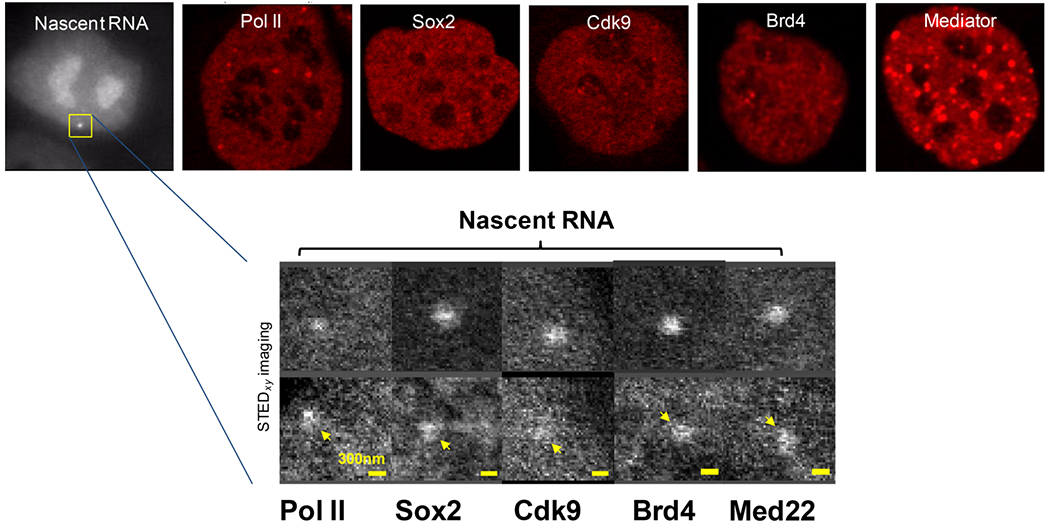
Figure 1. Sub-diffraction clusters of RNA Pol II and RFs at the Pou5f1 transcription site discovered by optical nanoscopy.

Top row: whole nucleus live-cell images, showing the Pou5f1 transcription site (Nascent RNA visualized using MCP-mNeonGreen binding to 24xMS2 stem-loops), as well as RNA Polymerase II (Rpb1 subunit), Sox2, Cdk9, Brd4 and Mediator (Med22 subunit), visualized using SNAP-tag knock-ins and a SiR dye. Bottom row shows zoomed-in regions of the vicinity of the transcription site in live-cells, showing small (5-20 molecules), sub-diffraction clusters of Pol II and RFs. Top row: A.P. and J.L., unpublished data; bottom row: reproduced, with permission, from [44].
