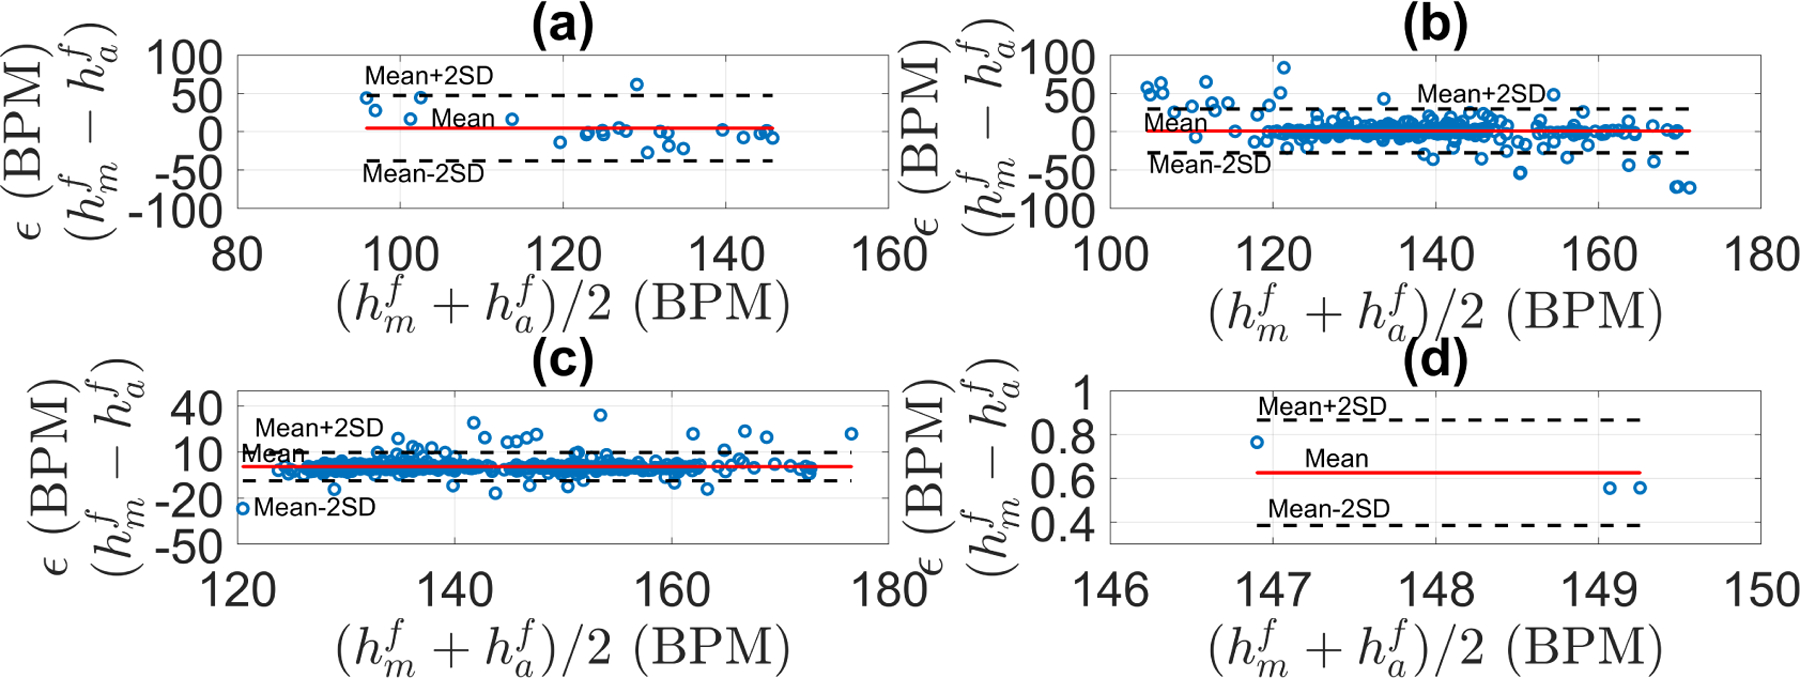
Figure 11:

Bland-Altman plots for the fetal heart rate estimation discriminated by signal quality for the Oxford dataset: (a) poor quality, (b) intermediate quality, (c) good quality, (d) excellent quality. Mean and standard deviation, level of agreement, and RSME for each class are shown in Table 5.
