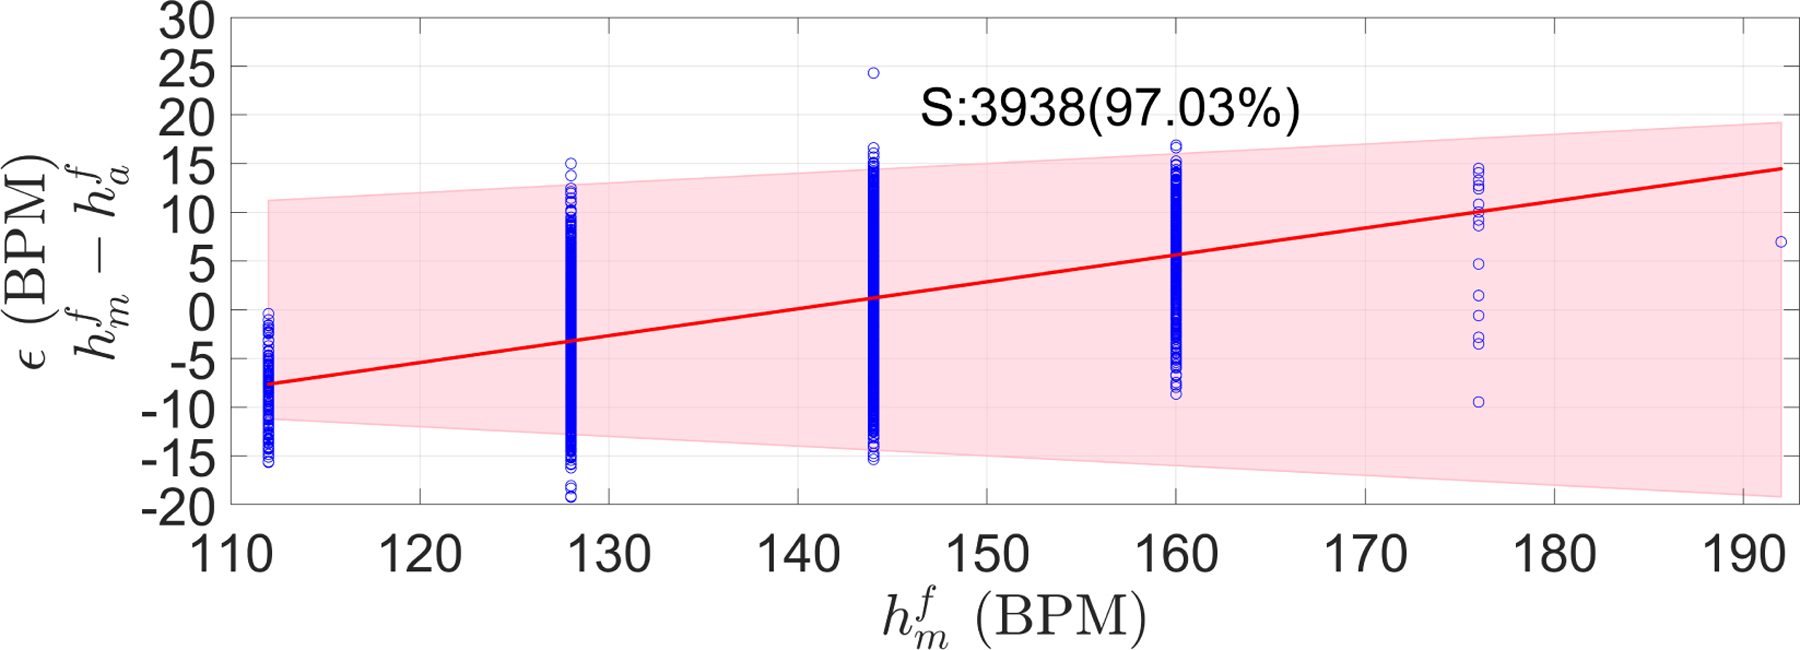
Figure 12:

Error (ϵ) measured as the difference between manual () and automatic FHR () estimations for Guatemala RCT dataset. The shaded area represents the PPA bound, defined as no greater than 10 percent of the . S stands for the number of segments, and in parenthesis is the percentage of segment satisfying the PPA bounds. Red line is the robust least square of ϵ along the manual FHR estimations ().
