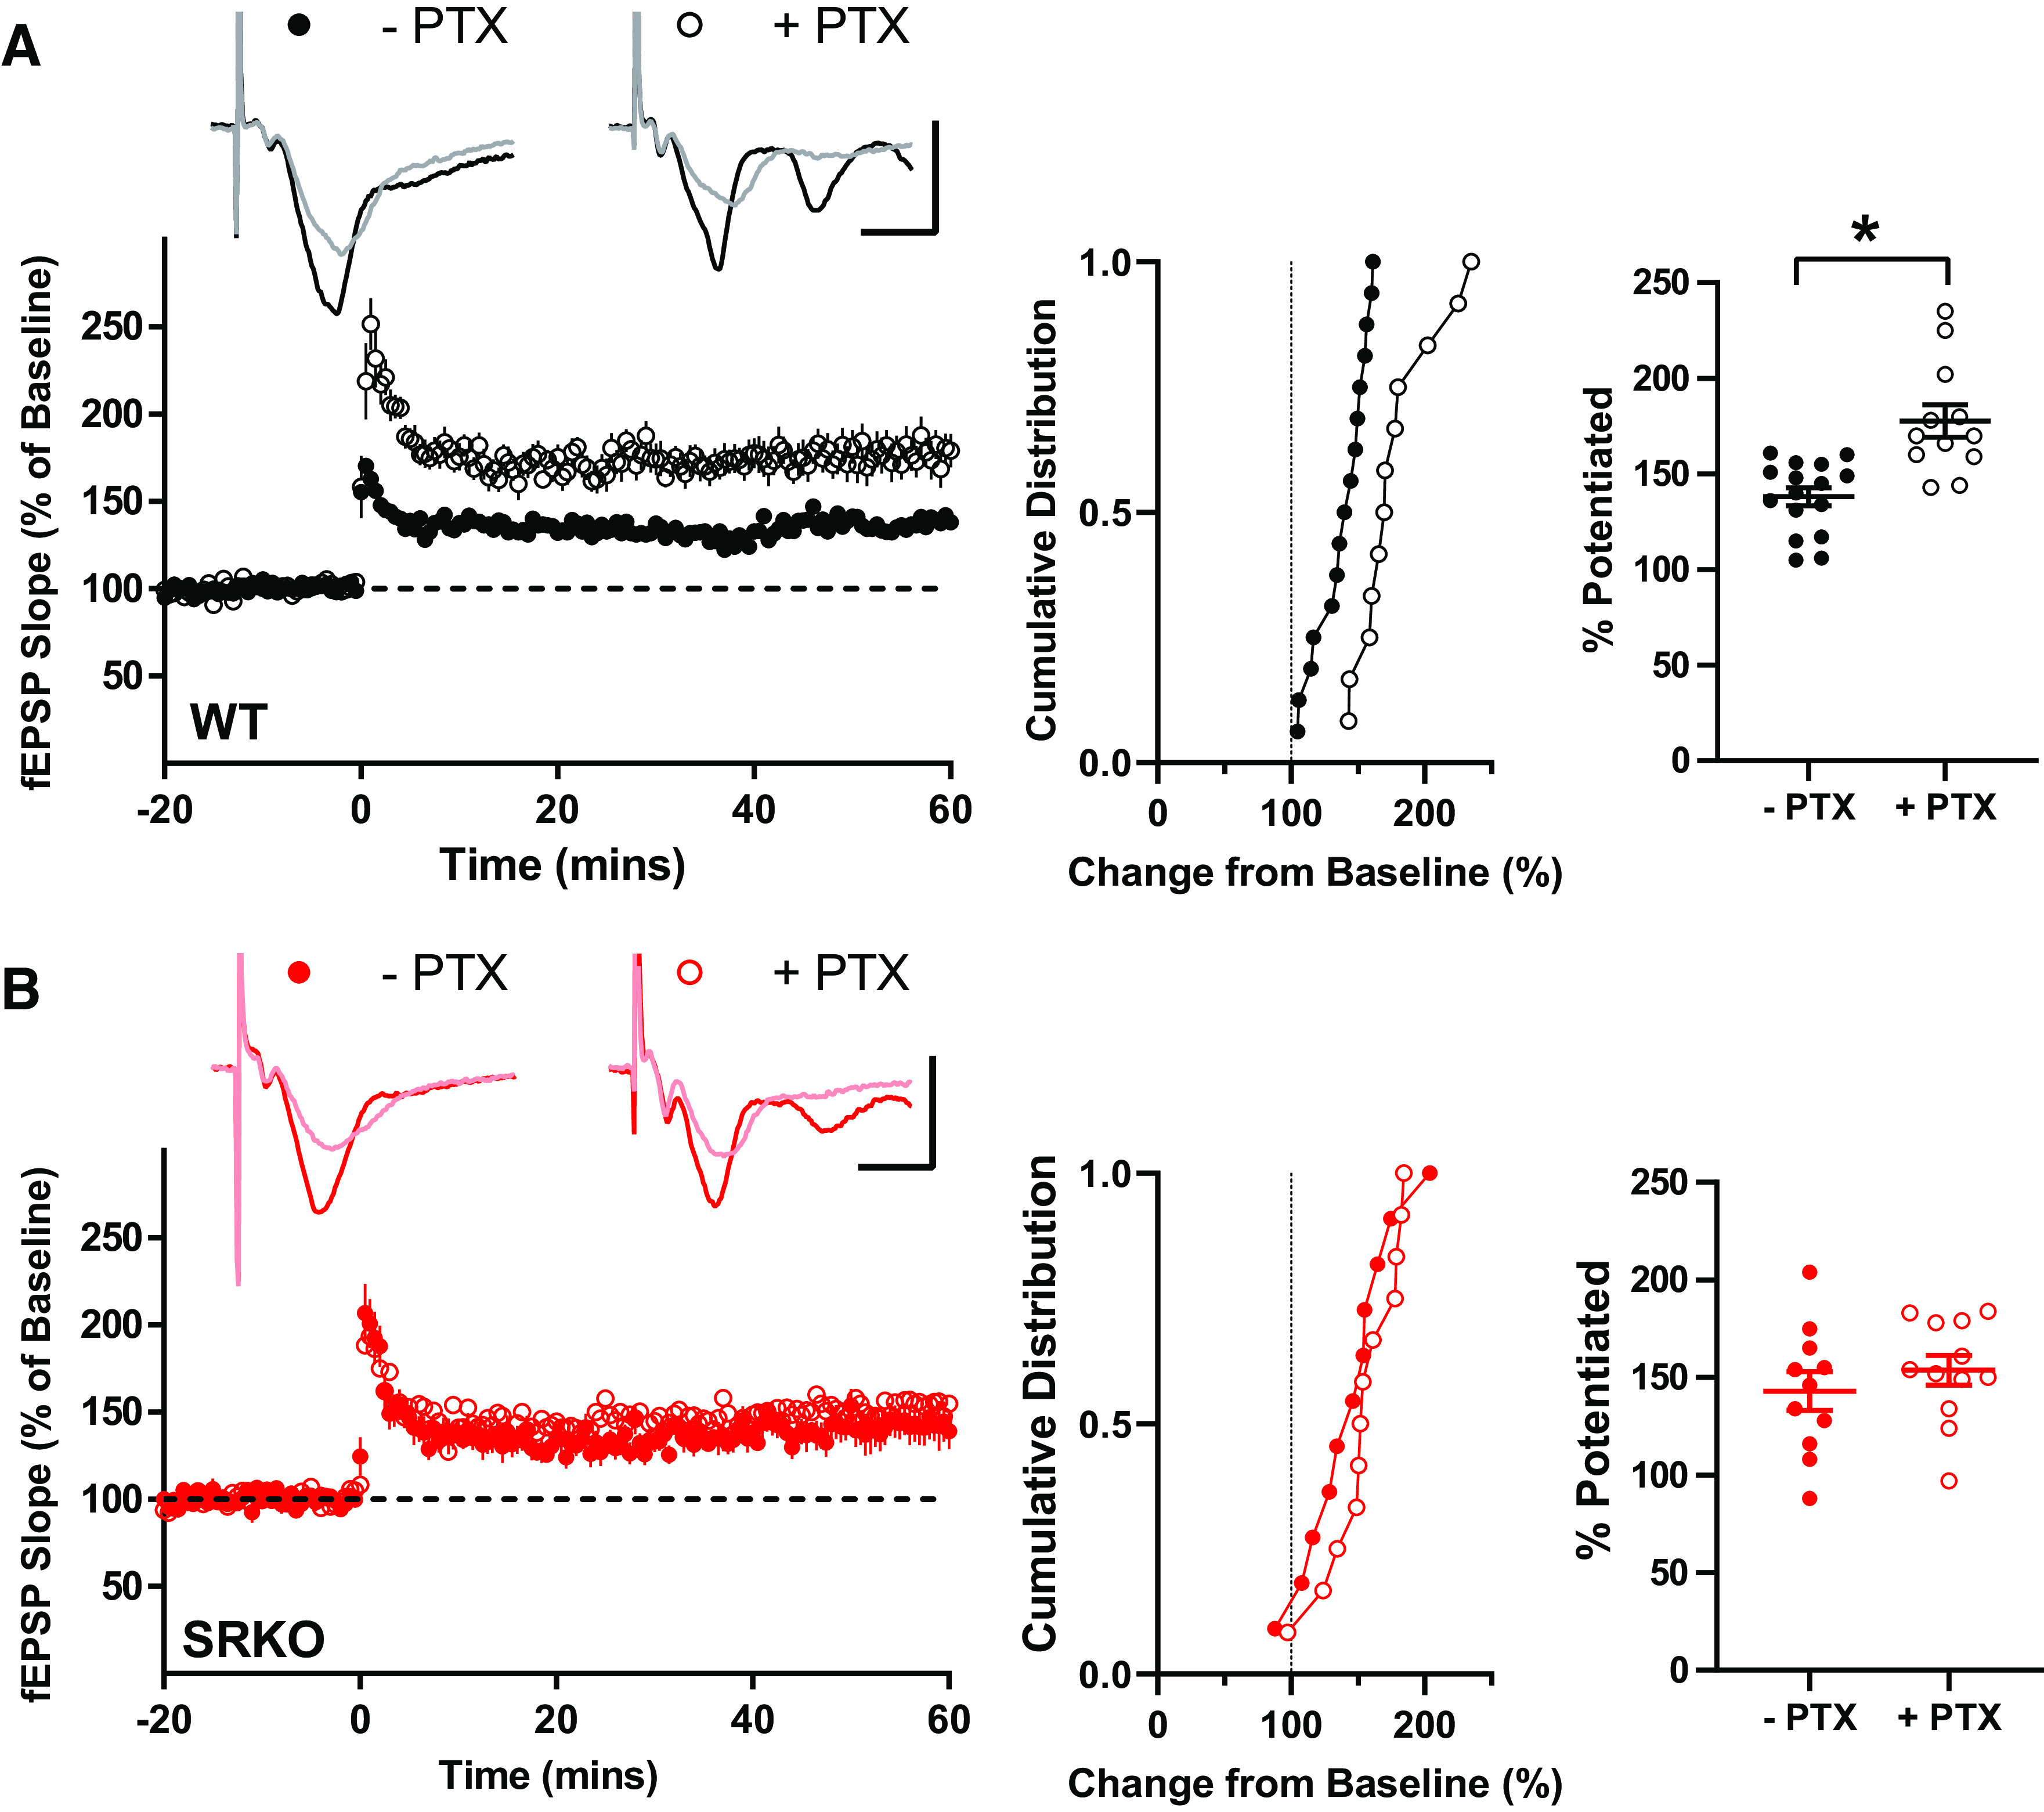
Figure 3.

Loss of picrotoxin-induced enhancement of long-term potentiation (LTP) in SRKO mice. A: traces represent superimposed fEPSPs recorded from WT slices during baseline and 60 min after high-frequency stimulation (HFS) in the presence (+) and absence (−) of 50 µM picrotoxin (PTX); scale bars: 1 mV, 20 ms. In slices from WT mice, PTX enhances LTP. Middle, the cumulative distribution of experiments. Right, summary graph of mean percentage potentiation relative to baseline demonstrating that PTX results in significantly enhanced LTP (−PTX: 138 ± 5% of baseline, n = 16; +PTX: 178 ± 7% of baseline, n = 12; P = 0.0002). B: traces represent superimposed fEPSPs recorded from SRKO slices during baseline and 60 min after HFS in the presence (+) and absence (−) of 50 µM PTX; scale bars: 1 mV, 20 ms. In slices from SRKO mice, PTX does not enhance LTP. Middle, the cumulative distribution of experiments. Right, summary graph of mean percentage potentiation relative to baseline showing no effect of PTX on LTP in slices from SRKO mice (−PTX: 143 ± 10% of baseline, n = 11; +PTX: 154 ± 8% of baseline, n = 11; p = 0.394). Data represent means ± SE. fEPSPs, field excitatory postsynaptic potentials; SRKO, serine racemase knockout; WT, wild type. *P < 0.05.
