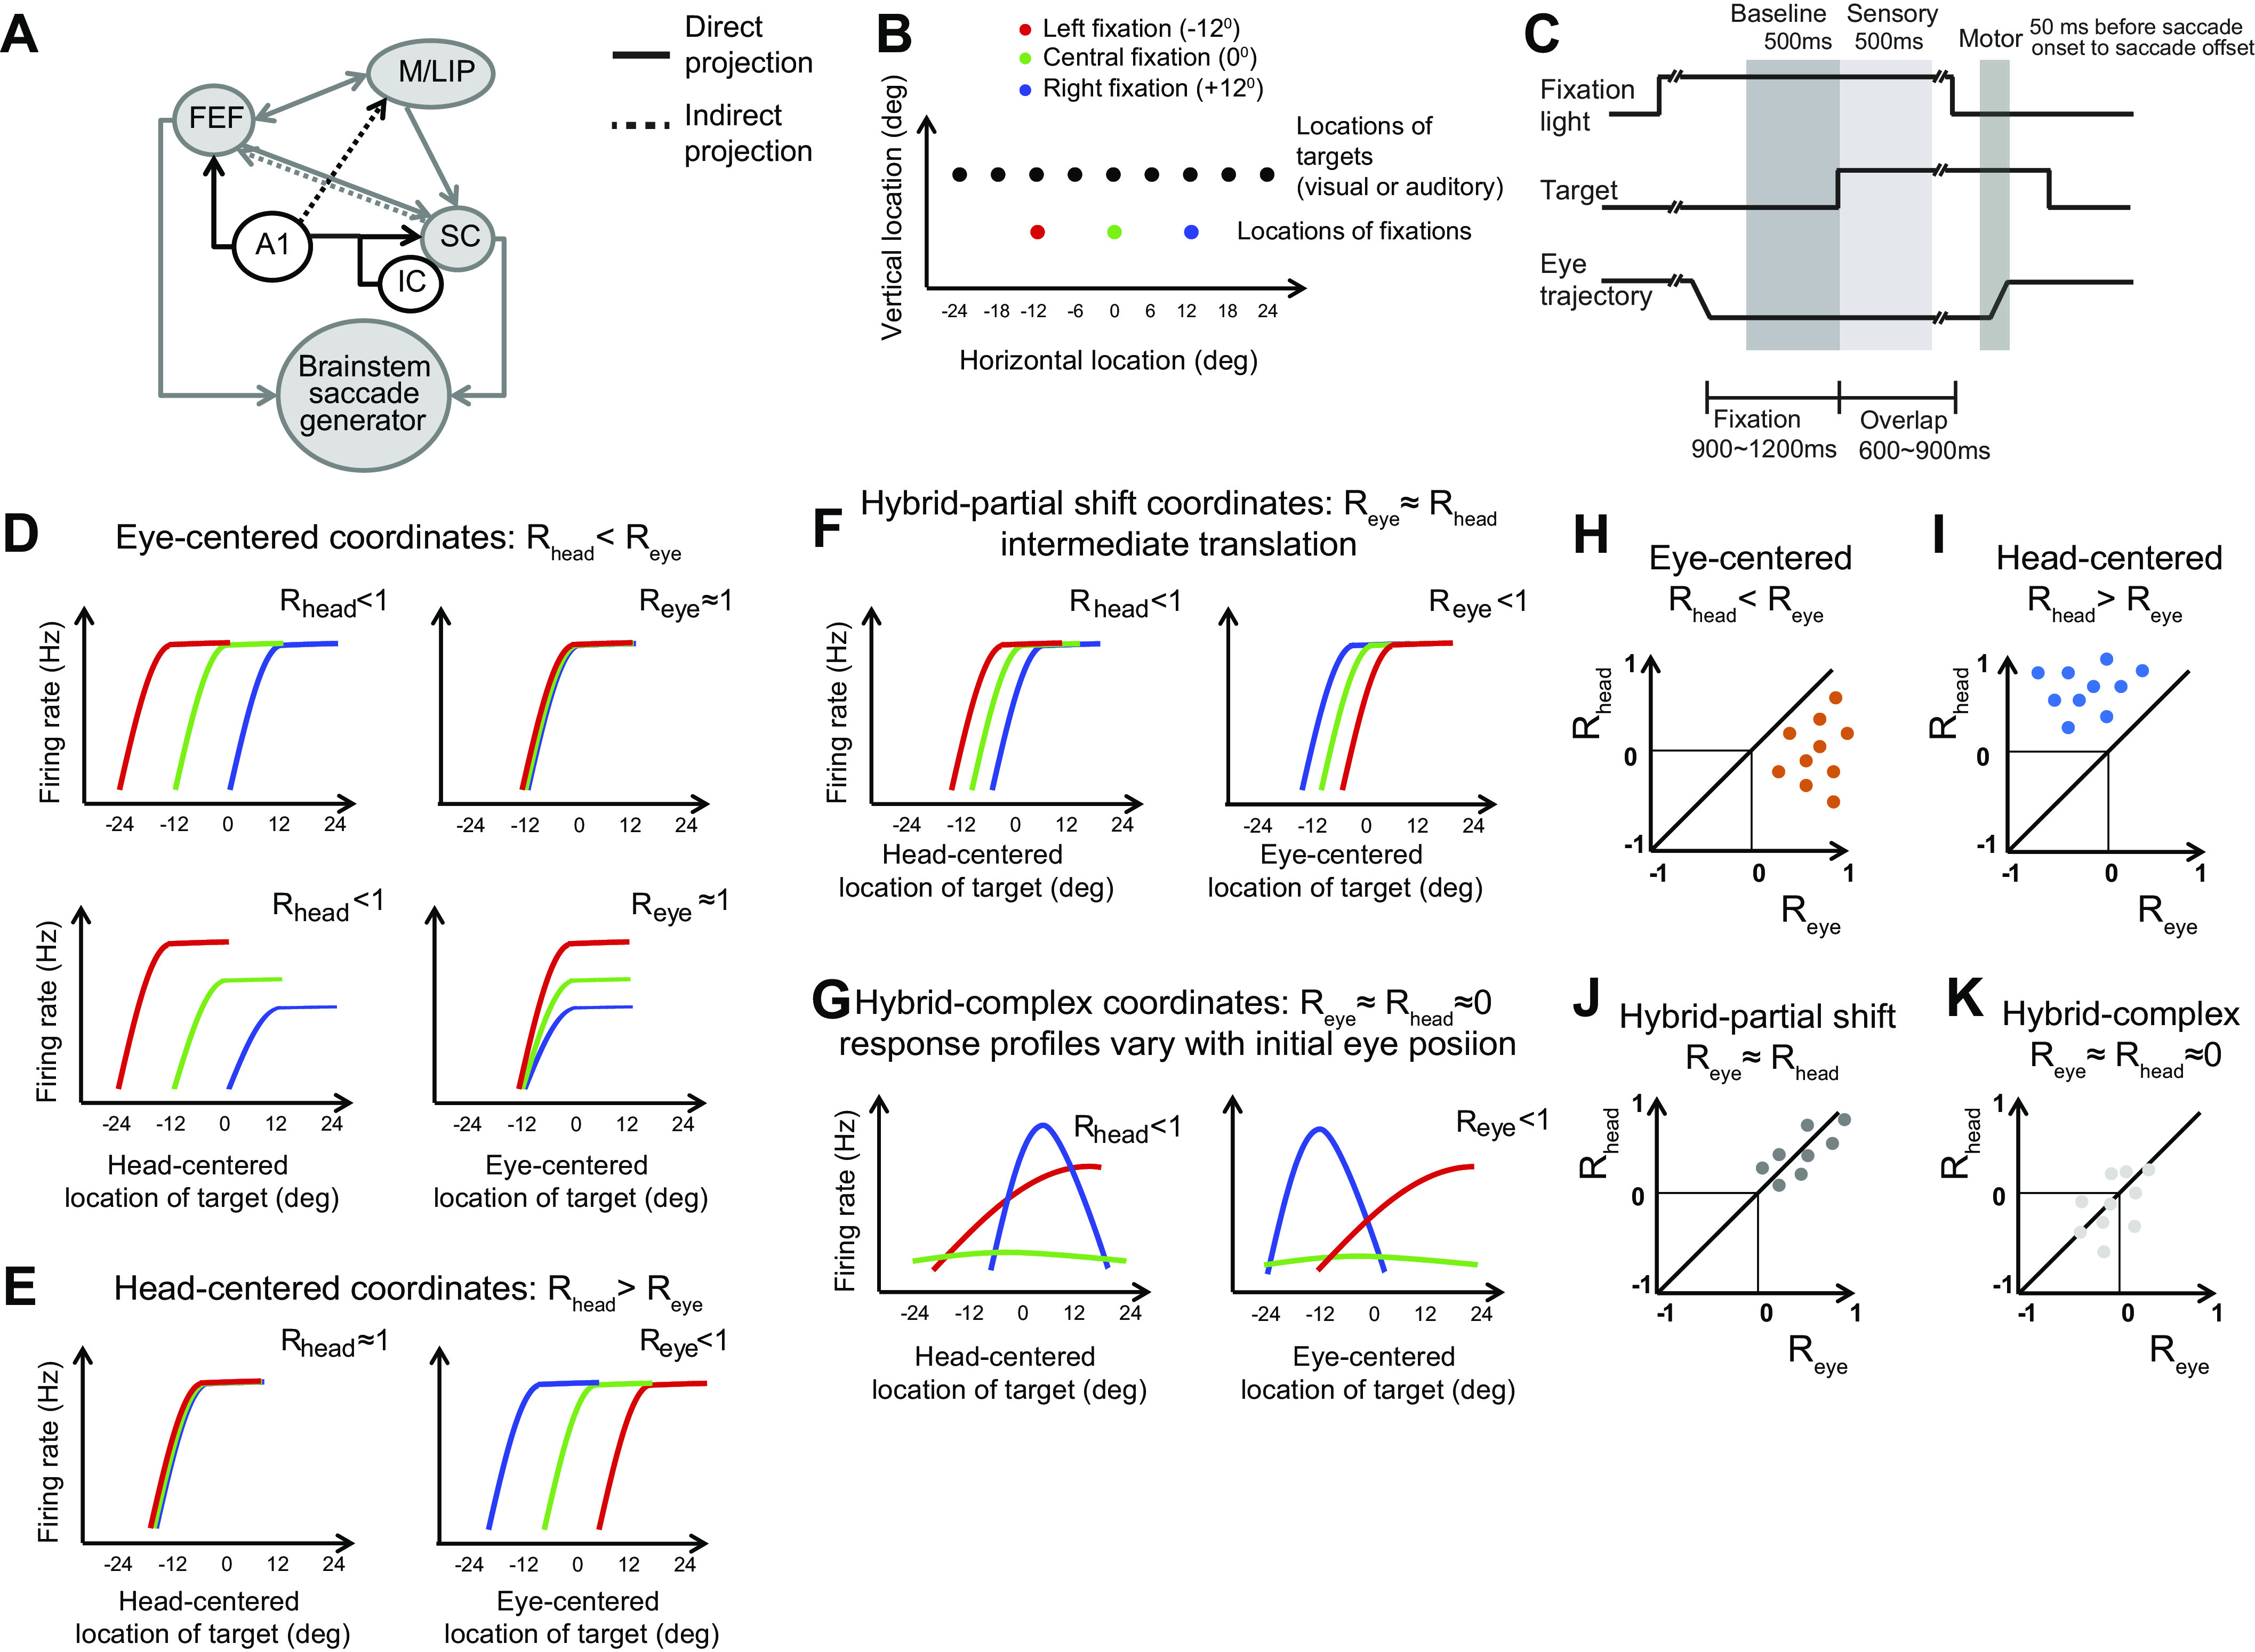
Figure 1.

Rationale of the study: the brain areas, stimuli, task, and quantification of reference frame. A: anatomical connections and auditory inputs of M/LIP, FEF, and SC. FEF and M/LIP receive auditory inputs from the primary auditory cortex (A1). The SC receives auditory inputs from the inferior colliculus (IC), auditory cortex, M/LIP, and FEF. B: locations of stimuli and initial fixations. All visual stimuli were green lights: the different colors of the fixation lights in the schematics serve to distinguish tuning curves constructed from different initial fixations in the following graphs. C: task: each trial starts with the appearance of a light which the monkey is required to fixate. After a variable delay of 900–1,200 ms, a visual or auditory target is presented. After a second variable delay of 600–900 ms, the fixation light disappears and the monkey reports the location of the target by saccading to it. D–G: schematics of the relative alignment of the tuning curves from three initial fixation positions plotted in head- and eye-centered coordinates. The strength of the tuning curve alignment in eye- and head-centered coordinates is quantified with the indices Reye and Rhead, which reflect the average correlation between tuning curves. D: eye-centered coordinates. The three tuning curves align well in eye-centered coordinates (Reye≈1, right) and are separated by the distance between the initial eye positions in head-centered coordinates (Rhead ≈ 0, left). Gain differences across tuning curve do not contribute to the metric chosen to quantify their alignment (bottom). E: head-centered coordinates. The pattern is the opposite of D. F: hybrid-partial shift coordinates. The three tuning curves are not perfectly aligned in either head- or eye-centered coordinates, but are separated by less than the distance between the fixation locations in both coordinate systems. G: hybrid-complex coordinates. Both the shape and the alignment vary with the initial eye location. H–K: assessment of reference frame trough the statistical comparison of Reye vs. Rhead for each cell. The coordinates systems are classified as eye-centered if Reye > Rhead (orange dots) (H), head-centered if Rhead > Reye (blue) (I), hybrid-partial shift if Reye ≈ Rhead ≠ 0 (dark gray) (J), hybrid complex if Reye ≈ Rhead ≈ 0 (light gray) (K). The quantitative comparison was carried out via a bootstrap analysis (see material and methods). FEF, frontal eye field; M/LIP, lateral and medial parietal cortex; SC, superior colliculus.
