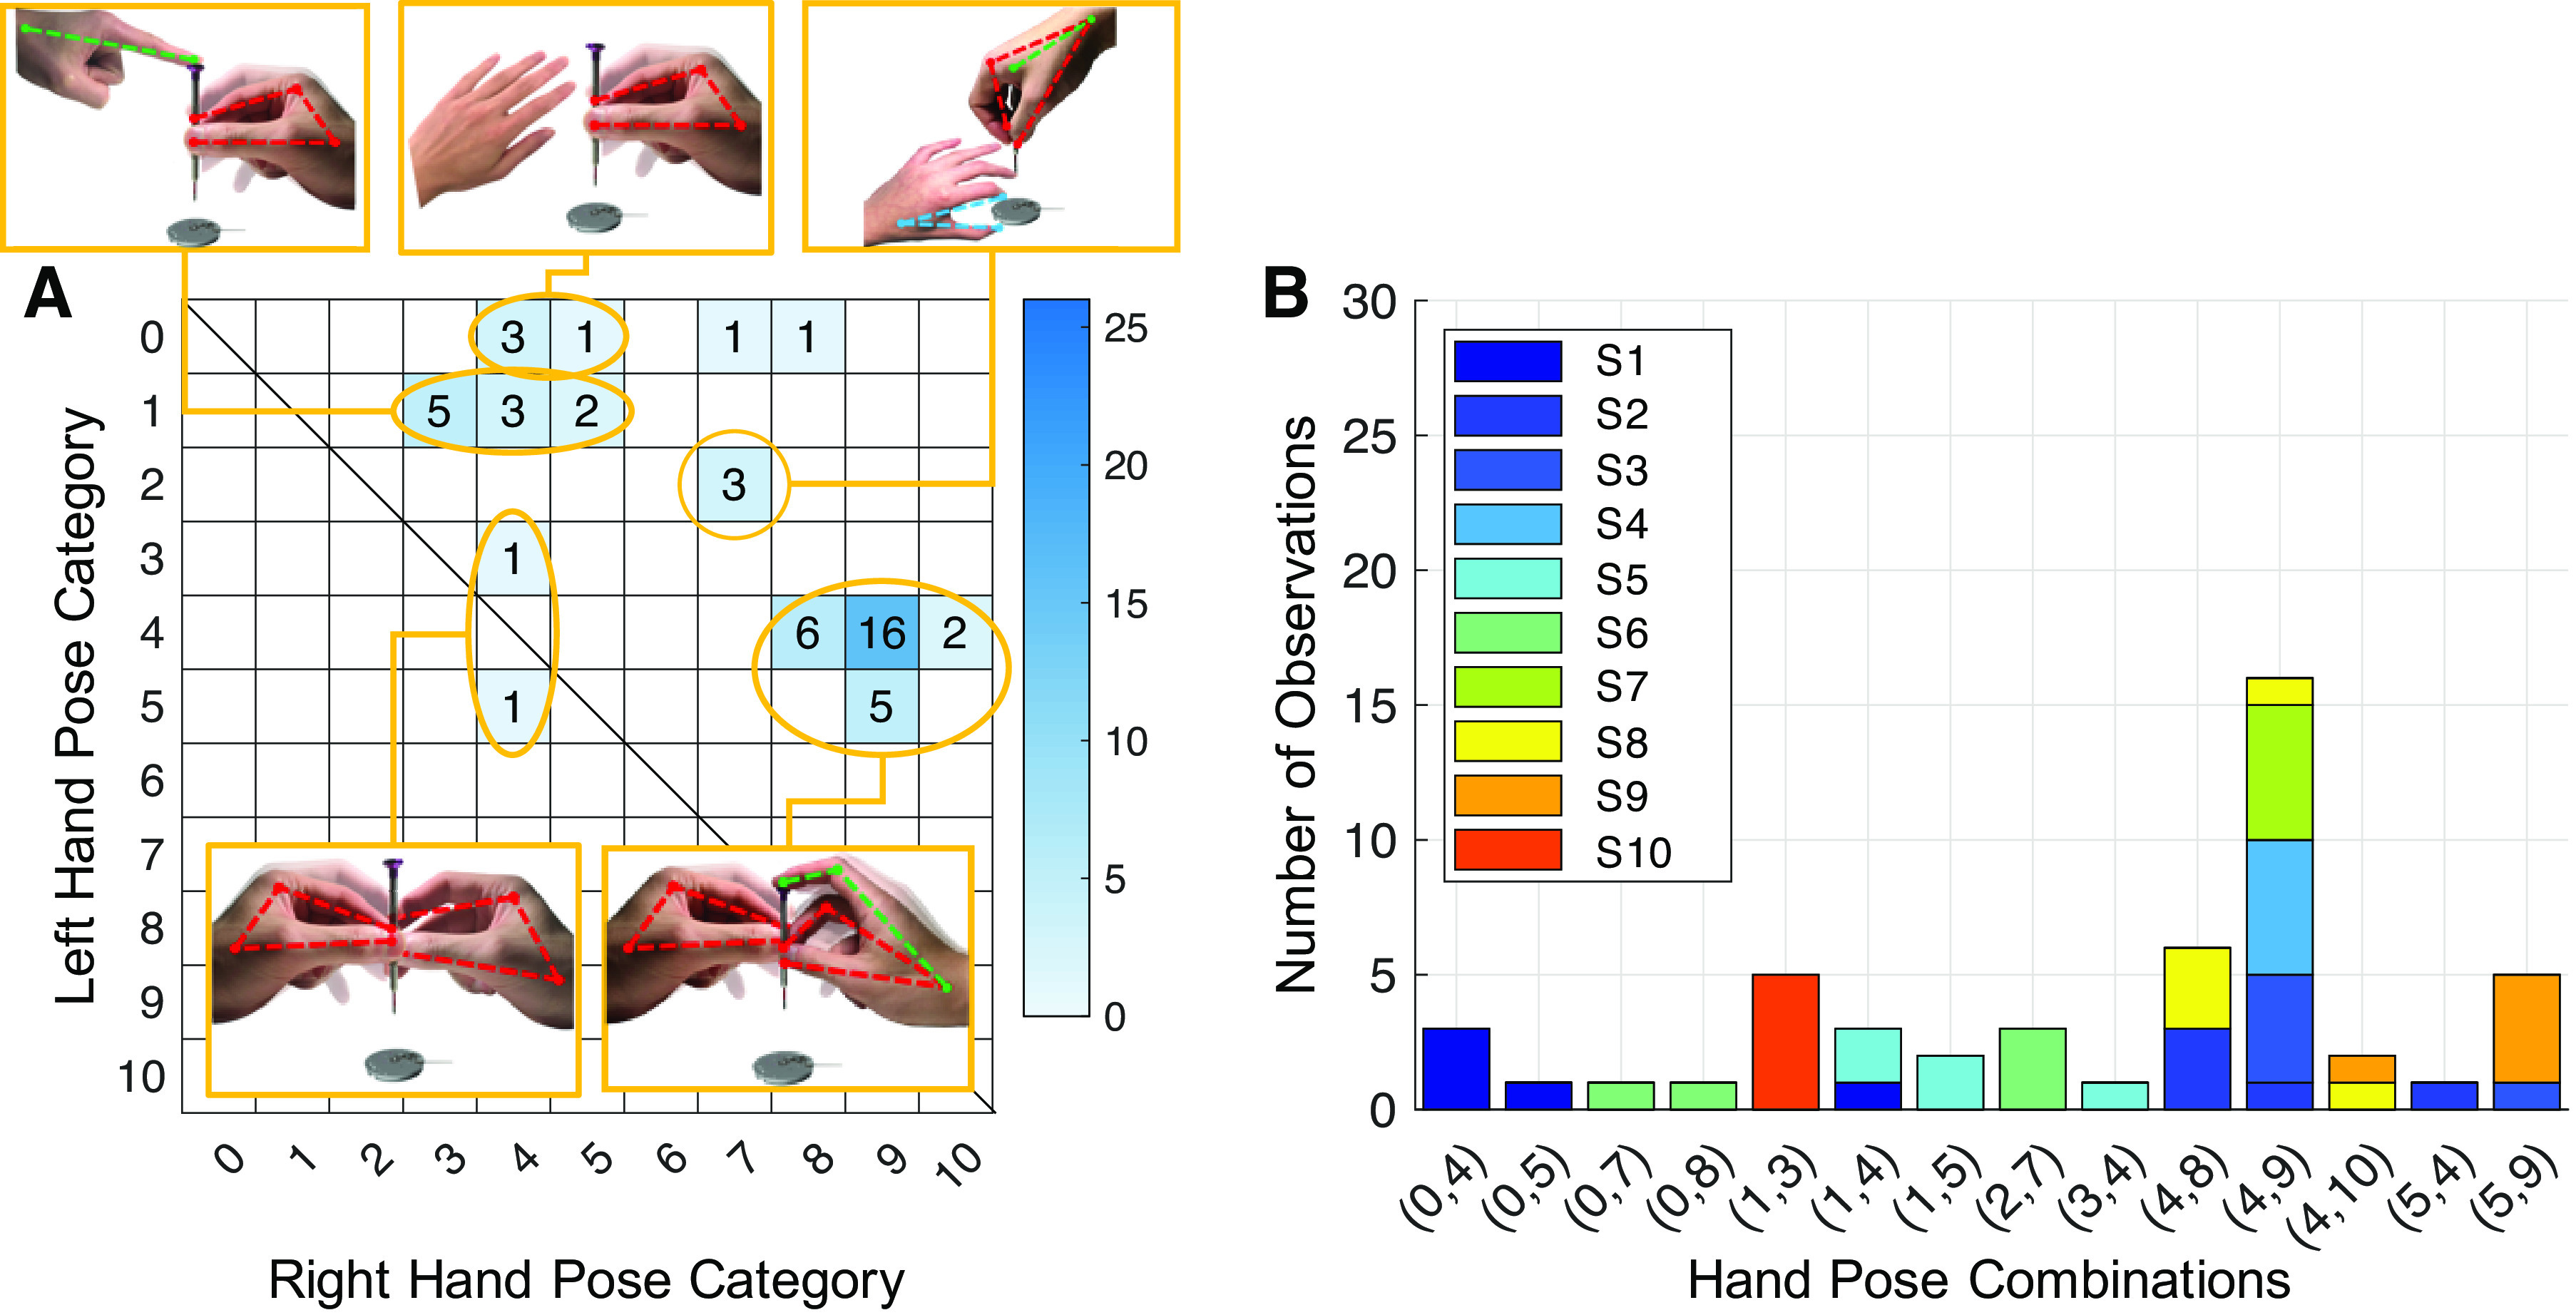
Figure 8.

Hand pose matrix and the corresponding composition by subject in the localization step of the fixed-base condition. A: hand pose matrix of the free-base condition visualized as a heat map with the color bar indicating the magnitude of values. Matrix entries are the number of observations. Empty cells indicate no observations. Hand pose combinations in the small figure correspond to one of the categorized combinations in Fig. 5. B: number of observations split by subjects. The X-axis lists all the hand pose combinations observed in this step and experimental condition. The Y-axis represents the number of observations for each hand pose combination. The colors indicate each subject’s contribution.
