Figure 5:

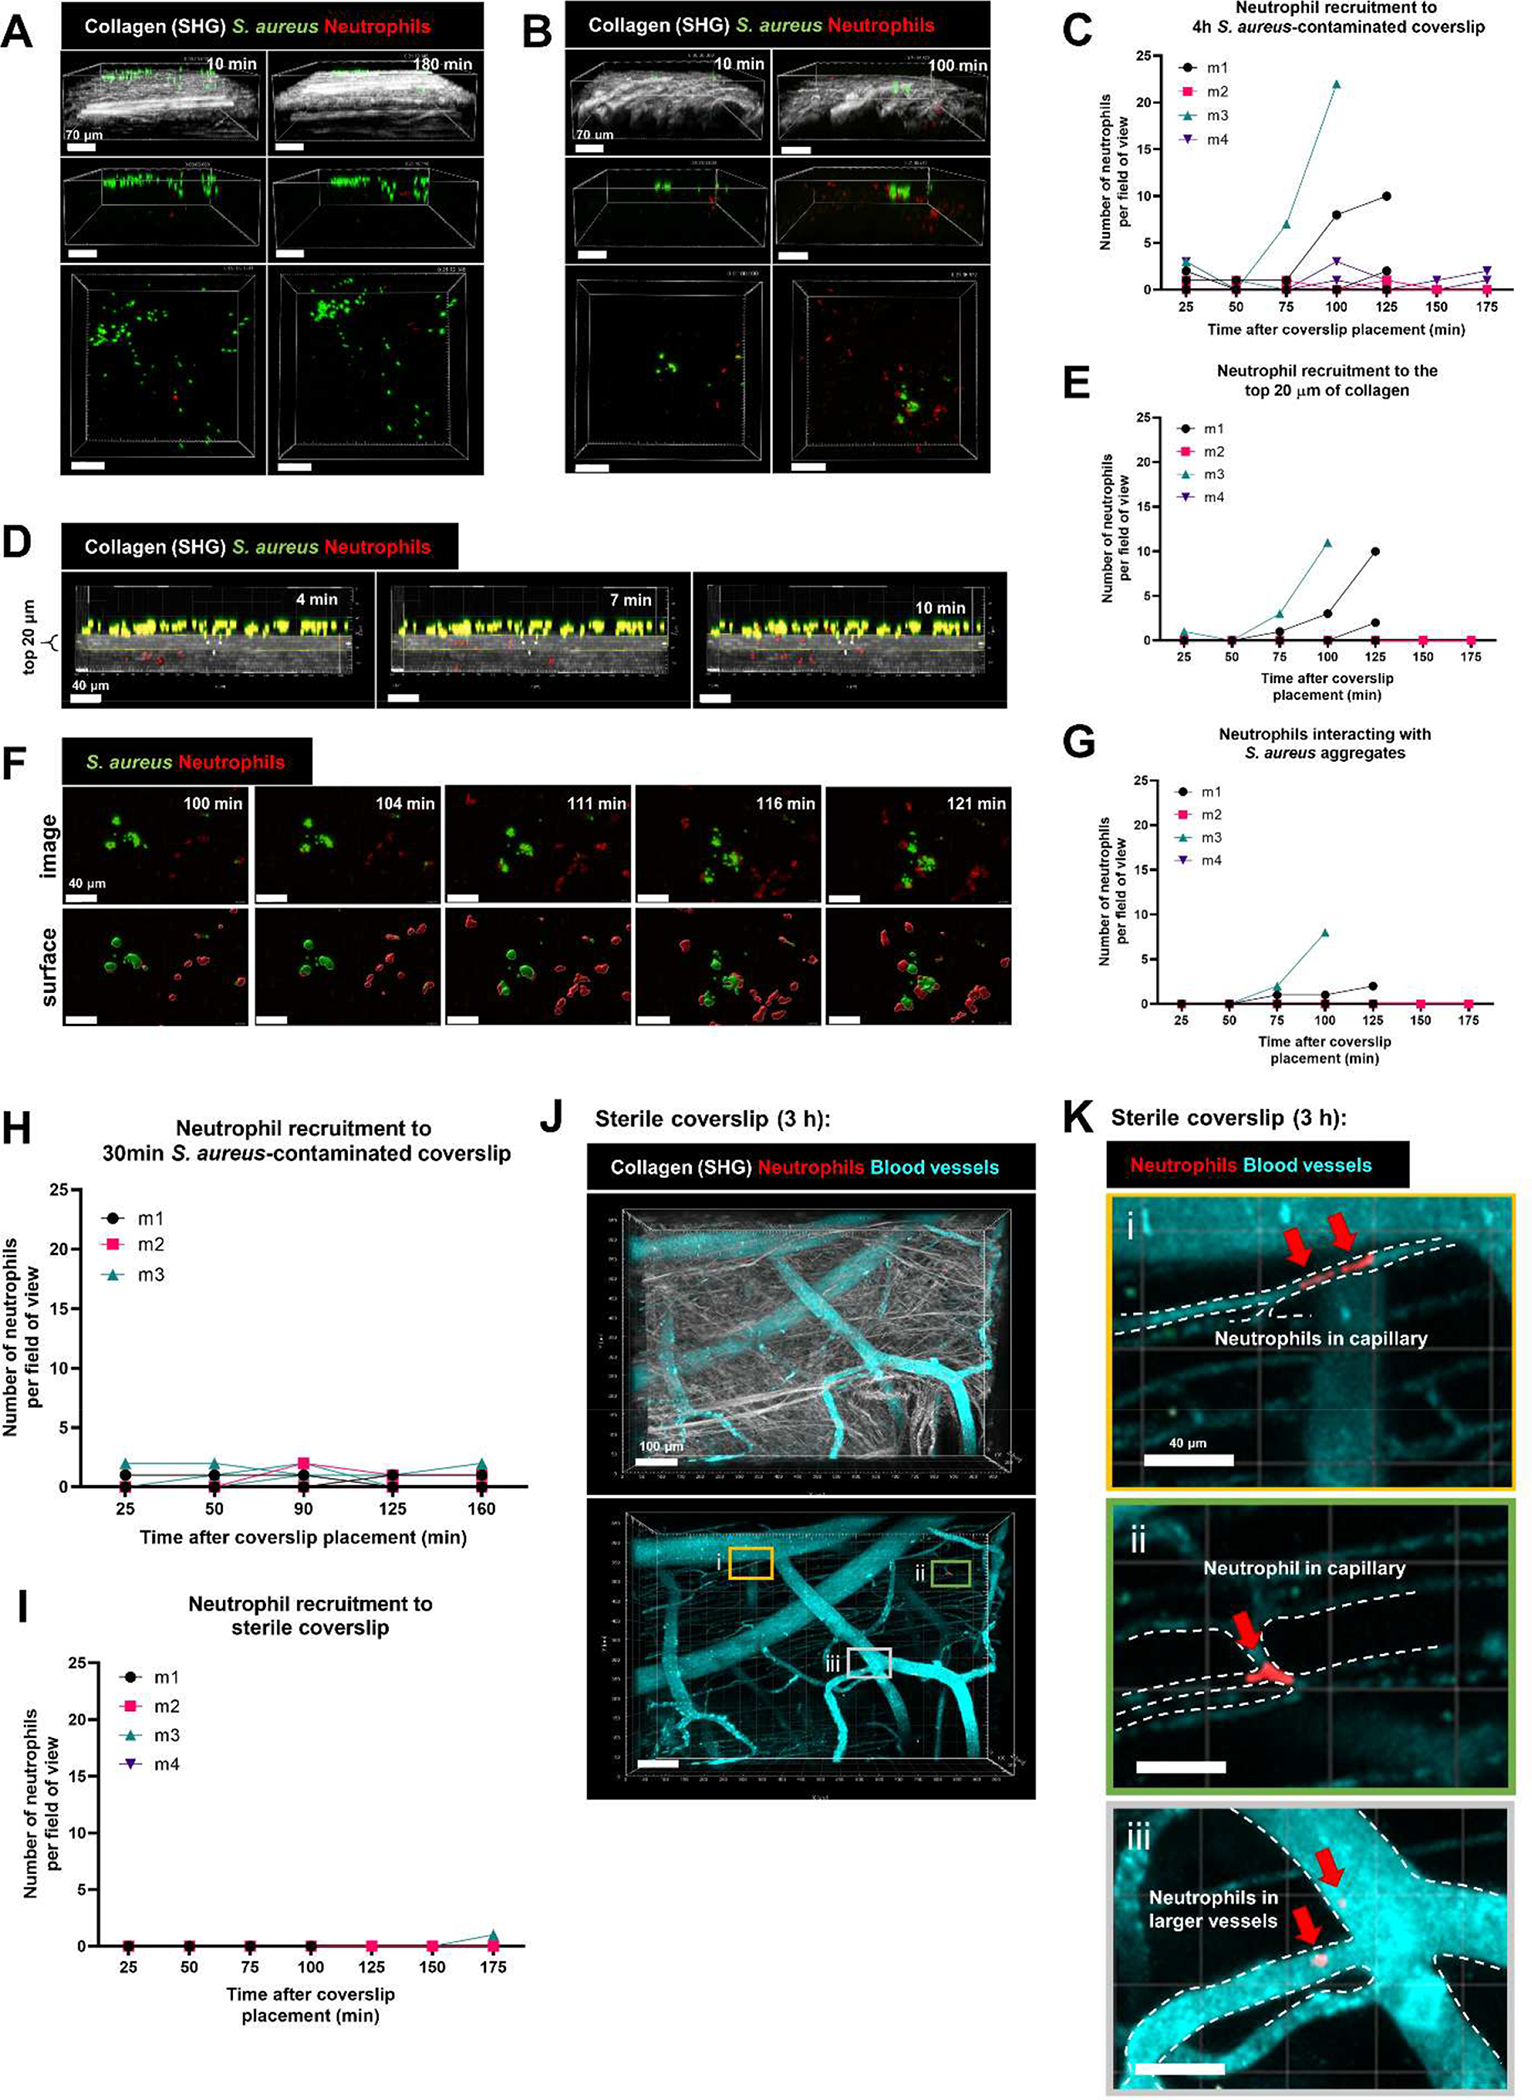
Minimal neutrophil recruitment to a S. aureus-contaminated coverslip in vivo. S. aureus aggregates were given 4 h to grow prior to placing the coverslip onto the dermal skin flap for intravital imaging. Representative 3D images of (A) minimal neutrophil recruitment and (B) moderate neutrophil recruitment at 10 min and 180 min after coverslip placement onto skin flap. Top: side view showing collagen (SHG) signal, middle: side view without collagen, bottom: top view without collagen. Scale bars = 70 μm. (C) Quantification of neutrophil recruitment to the 4 h S. aureus-contaminated coverslip. (D) Representative timelapse images of neutrophils (red spots) trafficking through the collagen into the top 20 μm. Scale bars = 40 μm. (E) Quantification of the number of neutrophils in the top 20 μm of collagen. (F) Representative timelapse images of neutrophils interacting with S. aureus aggregates at the coverslip surface over the course of 20 min. Scale bars = 40 μm. (G) Quantification of the number of neutrophils interacting with S. aureus. Quantification of (H) neutrophil recruitment to a single-cell 30-minute attached S. aureus-contaminated coverslip and (I) sterile coverslip. (J) Representative 3D stitched image of a sterile coverslip after 180 min of imaging, showing dermal collagen (white), blood vessels (cyan) and neutrophils (red). Bottom: identical 3D image without collagen. Scale bars = 100 μm. Three boxes (i, ii, iii) are selected to show one or two neutrophils in capillaries (K i, ii) and two neutrophils in larger dermal blood vessels (K iii). Scale bars = 40 μm. For C,E,G,H,I, n=3–4 mice from 3–4 independent experiments listed as m1, m2, m3, m4. Data show 3 fields of view per mouse.
