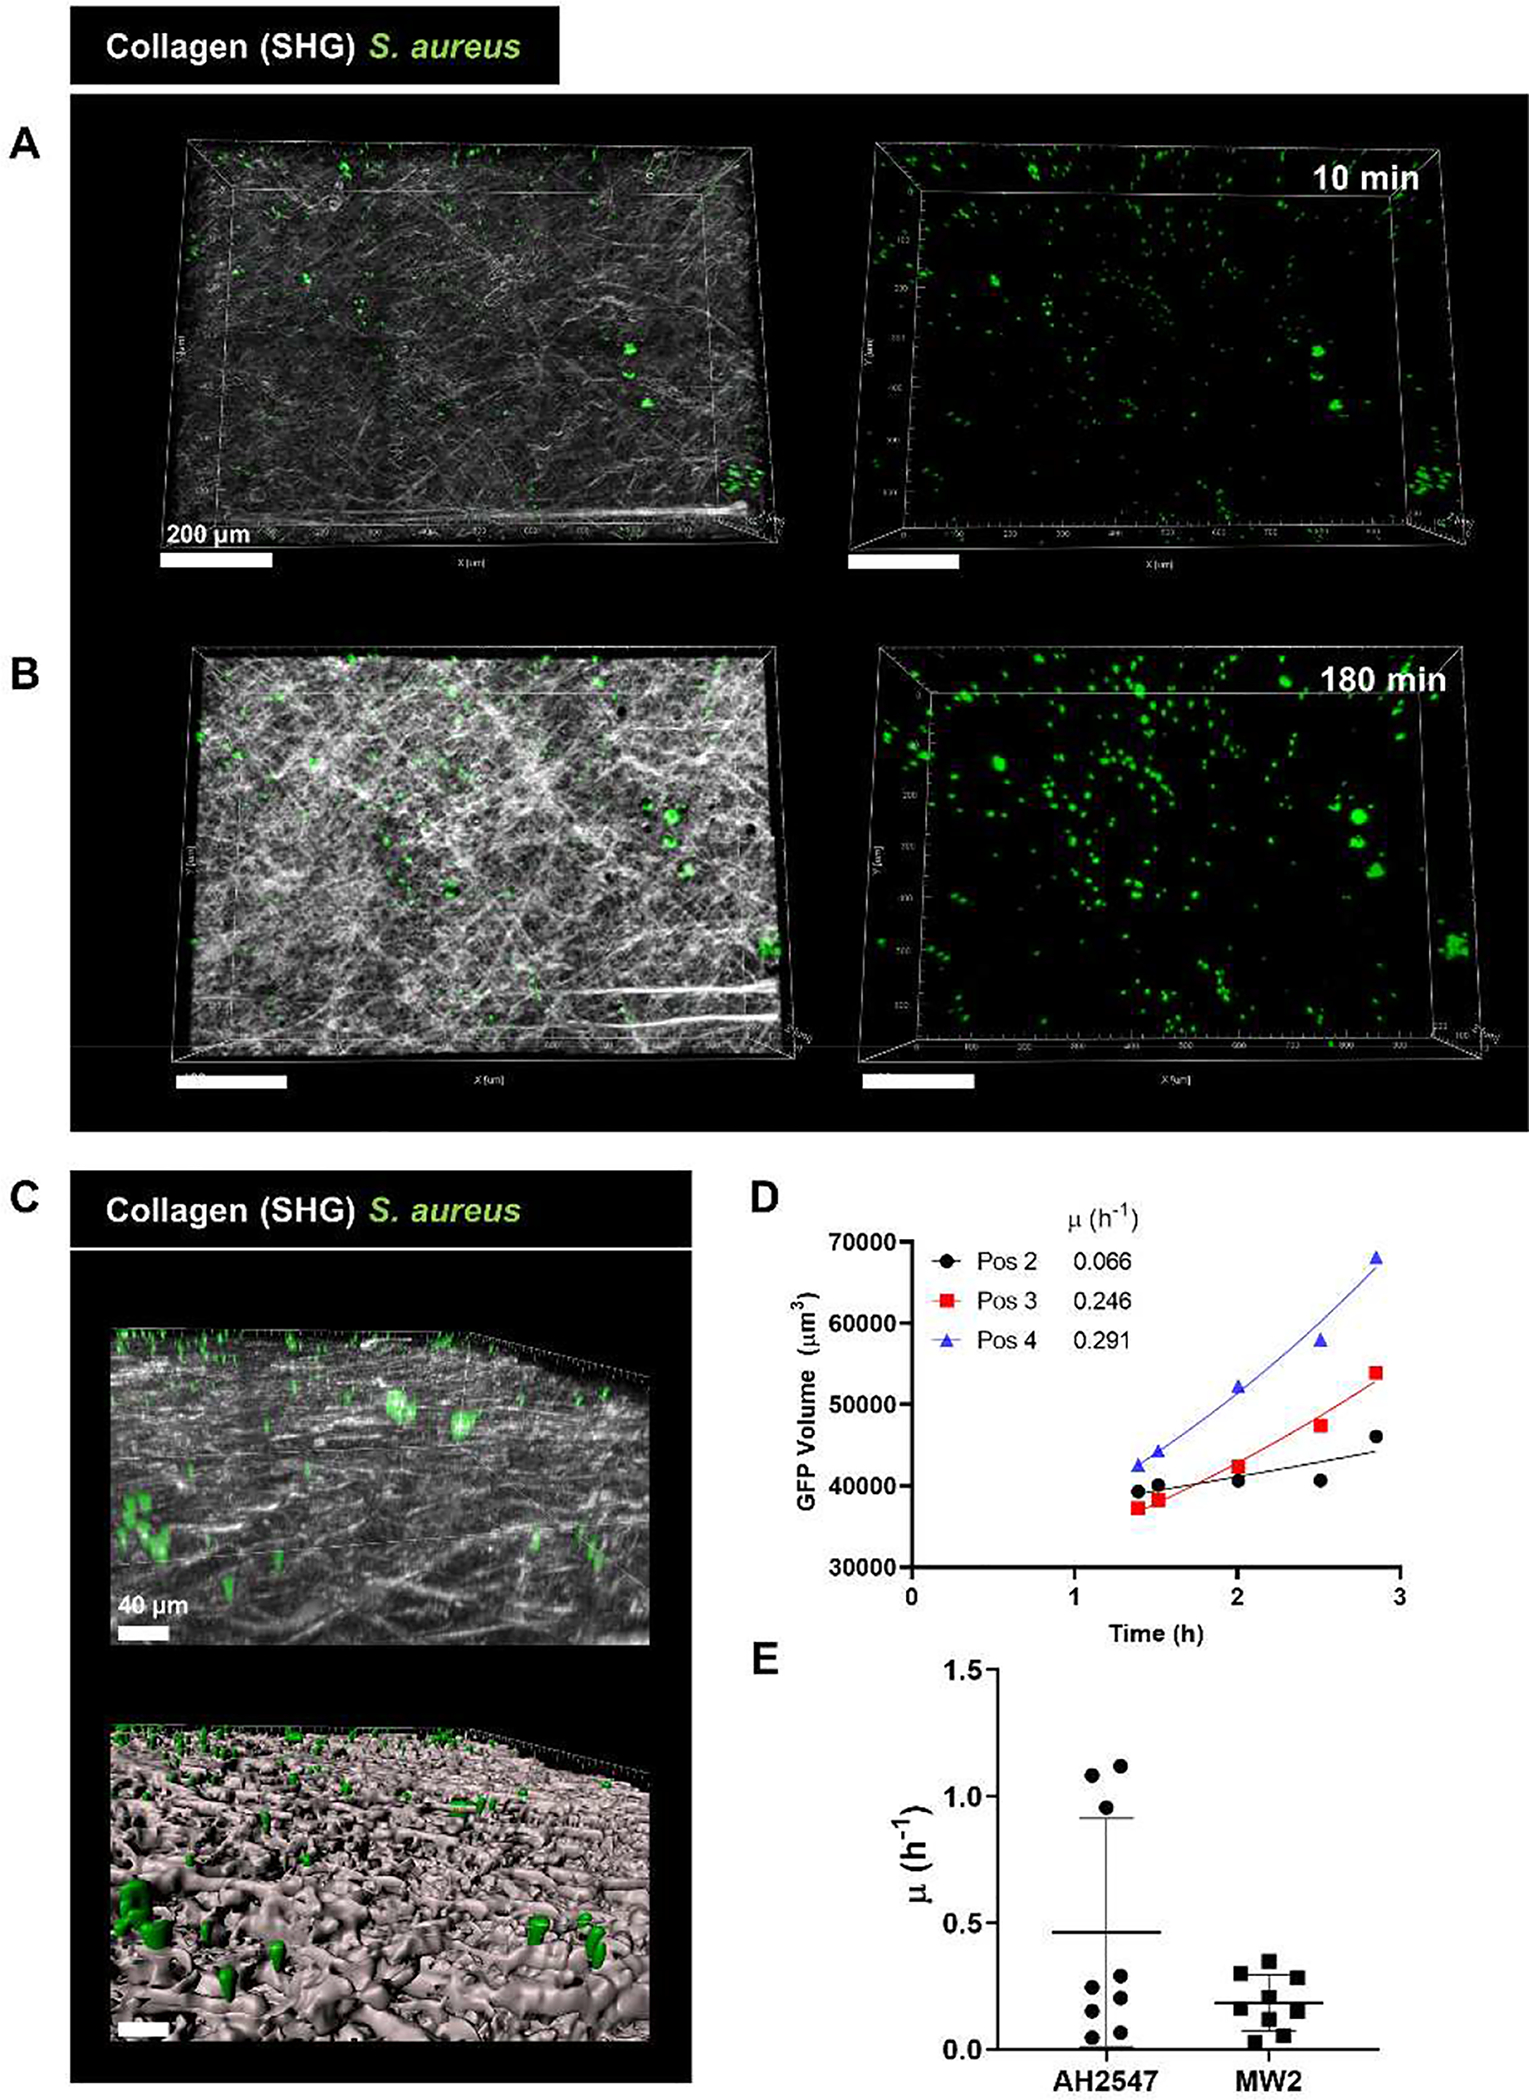
Figure 6:

S. aureus aggregates grow on the coverslip in vivo. (A) Representative intravital image of a 3D region recorded at (A) start of imaging (10 min after coverslip addition) and (B) end of imaging (180 min after coverslip addition). Left: collagen (white) and S. aureus (green), right: S. aureus signal only. Scale bars = 200 μm. (C) 3D reconstruction of the coverslip surface coverslip showing GFP S. aureus in close contact with collagen. Top: 3D image, bottom: surface reconstruction with Imaris. Scale bars = 40 μm (D) Representative quantification of S. aureus growth in vivo over 180 min of imaging with an exponential curve fit to the data. Reported value μ represents the specific growth rate satisfying the equation X = X0eμt. Data shown includes representative points outside of lag phase from one mouse with three fields of view. (E) Growth rate values measured in vivo. Points represent value measured from a single FOV. Error bars indicate mean ± SD. (n=3 mice/condition with 3 FOV per mouse).
